
Page 99 - 中国全科医学2022-11
P. 99
·1376· http://www.chinagp.net E-mail:zgqkyx@chinagp.net.cn
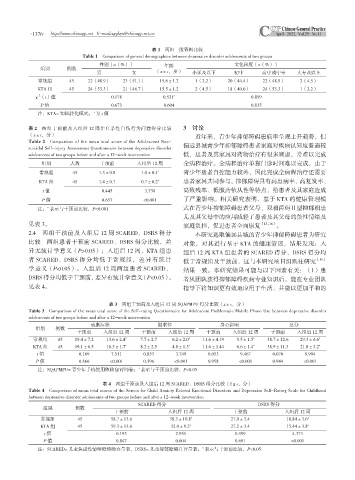
表 1 两组一般资料比较
Table 1 Comparison of general demographics between depressive disorder adolescents of two groups
性别〔n(%)〕 年龄 文化程度〔n(%)〕
组别 例数
男 女 ( ±s,岁) 小学及以下 初中 高中或中专 大专及以上
常规组 45 22(48.9) 23(51.1) 15.6±1.2 1(2.2) 20(44.4) 22(48.9) 2(4.5)
KTA 组 45 24(53.3) 21(46.7) 15.5±1.2 2(4.5) 18(40.0) 24(53.3) 1(2.2)
2
χ (t)值 0.178 0.521 a 0.859
P 值 0.673 0.604 0.835
a
注:KTA= 知识转化模式; 为 t 值
表 2 两组干预前及入组后 12 周非自杀性自伤行为问卷得分比较 3 讨论
( ±s,分) 近年来,青少年抑郁障碍患病率呈现上升趋势,但
Table 2 Comparison of the mean total score of the Adolescent Non-
suicidal Self-injury Assessment Questionnaire between depressive disorder 偏远县城青少年抑郁障碍患者家庭对疾病认知度普遍较
adolescents of two groups before and after a 12-week intervention 低,患者及其家属对药物治疗有很多顾虑,常难以完成
组别 人数 干预前 入组后 12 周 全病程治疗。全病程治疗单靠门诊时间难以完成,由于
常规组 45 1.5±0.8 1.0±0.4 a 青少年患者自控能力较差,因此完成全病程治疗还需要
KTA 组 45 1.4±0.7 0.7±0.2 a 患者家属共同参与。抑郁障碍具有高患病率、高复发率、
t 值 0.445 3.738 高致残率、低服药依从性等特点,给患者及其家庭造成
P 值 0.657 <0.001 了严重影响。相关研究表明,基于 KTA 的健康管理模
a
注: 表示与干预前比较,P<0.001 式在青少年抑郁障碍患者父母、双相障碍Ⅱ型抑郁相患
儿及其父母中的应用减轻了患者及其父母的负性情绪及
见表 3。 家庭负担,促进患者全面康复 [15-16] 。
2.4 两组干预前及入组后 12 周 SCARED、DSRS 得分 本研究选取偏远县城的青少年抑郁障碍患者为研究
比较 两组患者干预前 SCARED、DSRS 得分比较,差 对象,对其进行基于 KTA 的健康管理,结果发现:入
异无统计学意义(P>0.05);入组后 12 周,KTA 组患 组后 12 周 KTA 组患者的 SCARED 得分、DSRS 得分均
者 SCARED、DSRS 得分均低于常规组,差异有统计 低于常规组及干预前,这与本研究项目组既往研究 [15]
学意义(P<0.05)。入组后 12 周两组患者 SCARED、 结果一致。本研究结果可能与以下因素有关:(1)患
DSRS 得分均低于干预前,差异有统计学意义(P<0.05)。 者从团队获得抑郁障碍疾病专业知识后,能在专业团队
见表 4。 指导下将知识更有效地应用于生活,并能以更加平和的
表 3 两组干预前及入组后 12 周 SQAPMPU 得分比较( ±s,分)
Table 3 Comparison of the mean total score of the Self-rating Questionnaire for Adolescent Problematic Mobile Phone Use between depressive disorder
adolescents of two groups before and after a 12-week intervention
戒断症状 渴求性 身心影响 总分
组别 例数
干预前 入组后 12 周 干预前 入组后 12 周 干预前 入组后 12 周 干预前 入组后 12 周
常规组 45 19.4±7.2 13.6±2.4 a 7.7±2.7 6.2±2.0 a 11.6±4.19 9.5±1.5 a 38.7±12.6 29.3±4.6 a
KTA 组 45 19.1±6.5 10.3±1.7 a 8.2±2.5 4.8±1.3 a 11.6±3.44 6.6±1.4 a 38.9±11.3 21.8±3.2 a
t 值 0.169 7.511 0.853 3.749 0.053 9.467 0.070 8.994
P 值 0.866 <0.001 0.396 <0.001 0.958 <0.001 0.944 <0.001
a
注:SQAPMPU= 青少年手机使用依赖自评问卷; 表示与干预前比较,P<0.05
表 4 两组干预前及入组后 12 周 SCARED、DSRS 得分比较( ±s,分)
Table 4 Comparison of mean total scores of the Screen for Child Anxiety Related Emotional Disorders and Depression Self-Rating Scale for Childhood
between depressive disorder adolescents of two groups before and after a 12-week intervention
SCARED 得分 DSRS 得分
组别 例数
干预前 入组后 12 周 干预前 入组后 12 周
常规组 45 58.7±13.6 38.3±10.8 a 27.0±3.4 18.84±3.6 a
KTA 组 45 59.3±13.6 32.0±9.2 a 27.2±3.4 15.44±3.8 a
t 值 0.193 2.951 0.399 4.373
P 值 0.847 0.004 0.691 <0.001
a
注:SCARED= 儿童焦虑性情绪障碍筛查量表,DSRS= 儿童抑郁障碍自评量表; 表示与干预前比较,P<0.05