
Page 65 - 2022-22-中国全科医学
P. 65
·2750· http://www.chinagp.net E-mail:zgqkyx@chinagp.net.cn
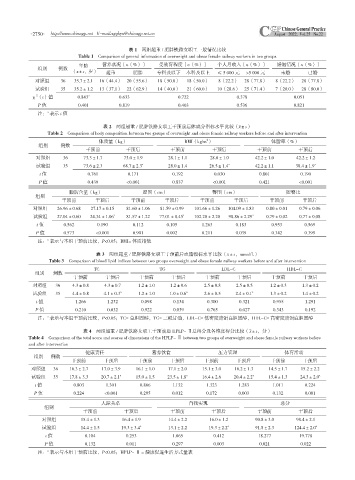
表 1 两组超重 / 肥胖铁路女职工一般情况比较
Table 1 Comparison of general information of overweight and obese female railway workers in two groups
年龄 营养状况〔n(%)〕 受教育程度〔n(%)〕 个人月收入〔n(%)〕 婚姻情况〔n(%)〕
组别 例数
( ±s,岁) 超重 肥胖 专科及以下 本科及以上 ≤ 5 000 元 >5 000 元 未婚 已婚
对照组 36 35.7±2.1 16(44.4) 20(55.6) 18(50.0) 18(50.0) 8(22.2) 28(77.8) 8(22.2) 28(77.8)
试验组 35 35.2±1.2 13(37.1) 22(62.9) 14(40.0) 21(60.0) 10(28.6) 25(71.4) 7(20.0) 28(80.0)
2
χ (t)值 0.843 a 0.633 0.722 0.378 0.051
P 值 0.401 0.819 0.403 0.536 0.821
a
注: 表示 t 值
表 2 两组超重 / 肥胖铁路女职工干预前后体成分指标水平比较( ±s)
Table 2 Comparison of body composition between two groups of overweight and obese female railway workers before and after intervention
2
体质量(kg) BMI(kg/m ) 体脂率(%)
组别 例数
干预前 干预后 干预前 干预后 干预前 干预后
对照组 36 73.3±1.7 73.0±1.9 28.1±1.1 28.0±1.0 42.2±1.0 42.2±1.2
试验组 35 73.6±2.3 68.7±2.3 a 28.0±1.4 26.5±1.4 a 42.2±1.1 38.4±1.9 a
t 值 0.761 0.171 0.192 0.030 0.801 0.190
P 值 0.439 <0.001 0.837 <0.001 0.421 <0.001
脂肪含量(kg) 腰围(cm) 臀围(cm) 腰臀比
组别
干预前 干预后 干预前 干预后 干预前 干预后 干预前 干预后
对照组 26.96±0.68 27.17±0.15 81.60±1.06 81.59±0.99 101.66±1.26 104.09±1.83 0.80±0.01 0.79±0.06
试验组 27.04±0.60 24.34±1.06 a 81.57±1.22 77.01±8.45 a 102.20±2.20 98.86±2.29 a 0.79±0.02 0.77±0.08
t 值 0.562 0.190 0.112 0.105 1.263 0.183 0.953 0.569
P 值 0.573 <0.001 0.901 0.002 0.211 0.039 0.342 0.399
a
注: 表示与本组干预前比较,P<0.05;BMI= 体质指数
表 3 两组超重 / 肥胖铁路女职工干预前后血脂指标水平比较( ±s,mmol/L)
Table 3 Comparison of blood lipid indices between two groups overweight and obese female railway workers before and after intervention
TC TG LDL-C HDL-C
组别 例数
干预前 干预后 干预前 干预后 干预前 干预后 干预前 干预后
对照组 36 4.3±0.8 4.3±0.7 1.2±1.0 1.2±0.6 2.5±0.8 2.5±0.5 1.2±0.3 1.3±0.2
试验组 35 4.4±0.8 4.1±0.3 a 1.2±1.0 1.0±0.6 a 2.6±0.5 2.4±0.1 a 1.3±0.2 1.4±0.2
t 值 1.266 1.232 0.098 0.134 0.300 0.321 0.955 1.291
P 值 0.210 0.032 0.922 0.039 0.765 0.027 0.343 0.192
a
注: 表示与本组干预前比较,P<0.05;TC= 总胆固醇,TG= 三酰甘油,LDL-C= 低密度脂蛋白胆固醇,HDL-C= 高密度脂蛋白胆固醇
表 4 两组超重 / 肥胖铁路女职工干预前后 HPLP- Ⅱ总得分及各维度得分比较( ±s,分)
Table 4 Comparison of the total score and scores of dimensions of the HPLP- Ⅱ between two groups of overweight and obese female railway workers before
and after intervention
健康责任 营养饮食 压力管理 体育活动
组别 例数
干预前 干预后 干预前 干预后 干预前 干预后 干预前 干预后
对照组 36 16.3±2.7 17.0±3.9 16.1±1.0 17.1±2.0 15.1±3.0 16.2±1.3 14.5±1.7 15.2±2.2
试验组 35 17.8±3.3 20.7±2.1 a 15.0±1.5 23.5±1.8 a 16.4±2.6 20.4±2.2 a 15.4±1.3 24.3±2.0 a
t 值 0.803 1.301 0.866 1.132 1.323 1.283 1.011 0.224
P 值 0.224 <0.001 0.295 0.012 0.172 0.003 0.132 0.001
人际关系 自我实现 总分
组别
干预前 干预后 干预前 干预后 干预前 干预后
对照组 15.4±1.3 16.4±1.9 14.4±2.2 16.0±1.2 90.8±3.0 98.4±2.1
试验组 14.4±1.5 19.3±3.4 a 13.1±2.2 19.3±2.2 a 91.8±2.3 124.4±2.0 a
t 值 0.104 0.253 1.065 0.412 18.277 19.778
P 值 0.132 0.011 0.297 0.003 0.021 0.022
a
注: 表示与本组干预前比较,P<0.05;HPLP- Ⅱ = 健康促进生活方式量表