Page 89 - 2023-05-中国全科医学
P. 89

·602·  http: //www.chinagp.net   E-mail: zgqkyx@chinagp.net.cn                    February  2023, Vol.26  No.5


                                                   图 2 纳入研究偏倚风险图
                                               Figure 2 Risk of bias in included studies

                Lfx              Mfx              Lfx              Mfx              Lfx              Mfx
             A                                  B                                 C


            Lzd                               Lzd                               Lzd
                                          P                                P                                 P


                 Cfz             Bdq              Cfz              Bdq              Cfz             Bdq
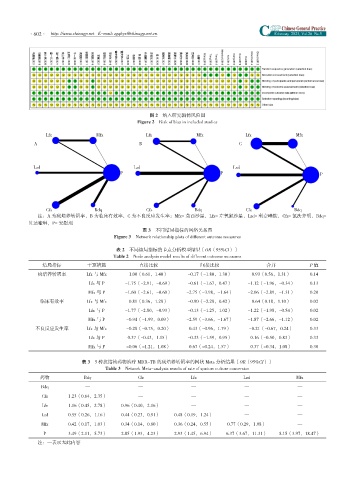
              注:A 为痰培养转阴率,B 为临床有效率,C 为不良反应发生率;Mfx= 莫西沙星,Lfx= 左氧氟沙星,Lzd= 利奈唑胺,Cfz= 氯法齐明,Bdq=
           贝达喹啉,P= 安慰剂
                                                 图 3 不同结局指标的网络关系图
                                       Figure 3 Network relationship plots of different outcome measures

                                        表 2 不同结局指标的节点分析模型结果〔OR(95%CI)〕
                                       Table 2 Node analysis model results of different outcome measures
               结局指标           干预措施              直接比较                 间接比较                  合并            P 值
              痰培养转阴率          Lfx 与 Mfx      1.00(0.61,1.40)    -0.17(-1.80,1.30)     0.93(0.56,1.31)    0.14
                               Lfx 与 P     -1.75(-2.91,-0.69)   -0.61(-1.67,0.47)    -1.12(-1.96,-0.34)  0.13
                               Mfx 与 P     -1.60(-2.61,-0.60)   -2.75(-3.98,-1.64)   -2.06(-2.89,-1.31)  0.20
               临床有效率          Lfx 与 Mfx      0.81(0.36,1.28)    -0.90(-2.28,0.42)     0.64(0.18,1.10)    0.02
                               Lfx 与 P     -1.77(-2.80,-0.93)   -0.13(-1.25,1.02)    -1.22(-1.98,-0.54)  0.02
                               Mfx 与 P      -0.94(-1.99,0.09)   -2.59(-3.66,-1.67)   -1.87(-2.66,-1.12)  0.02
             不良反应发生率          Lfx 与 Mfx     -0.28(-0.75,0.20)    0.43(-0.96,1.79)    -0.21(-0.67,0.24)   0.33
                               Lfx 与 P      0.37(-0.43,1.15)    -0.33(-1.59,0.95)    0.16(-0.50,0.83)    0.33
                               Mfx 与 P      -0.06(-1.21,1.08)    0.67(-0.24,1.57)    0.37(-0.34,1.08)    0.30


                             表 3 5 种抗结核药物治疗 MDR-TB 的痰培养转阴率的网状 Meta 分析结果〔OR(95%CI)〕
                                     Table 3 Network Meta-analysis results of rate of sputum culture conversion
               药物            Bdq               Cfz               Lfx               Lzd               Mfx
               Bdq            —                 —                 —                —                 —
               Cfz      1.23(0.64,2.35)         —                 —                —                 —
               Lfx      1.16(0.45,2.78)   0.96(0.40,2.16)         —                —                 —
               Lzd      0.55(0.26,1.16)   0.44(0.23,0.91)   0.48(0.19,1.24)        —                 —
               Mfx      0.42(0.17,1.03)   0.34(0.14,0.80)   0.36(0.24,0.55)   0.77(0.29,1.98)        —
                P       3.49(2.11,5.73)   2.85(1.93,4.23)   2.93(1.45,6.94)  6.37(3.67,11.31)  8.15(3.97,18.47)
              注:—表示无此内容
   84   85   86   87   88   89   90   91   92   93   94