
Page 45 - 2023-01-中国全科医学
P. 45
·40· http: //www.chinagp.net E-mail: zgqkyx@chinagp.net.cn January 2023, Vol.26 No.1
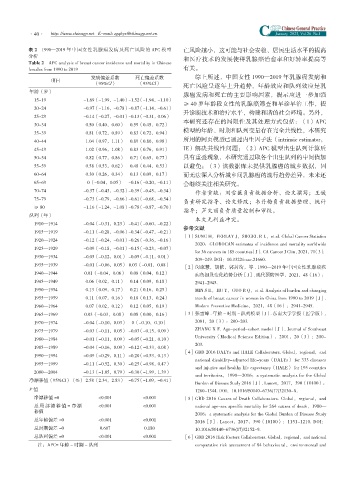
表 2 1990—2019 年中国女性乳腺癌发病及死亡风险的 APC 模型 亡风险越小,这可能与社会安稳、居民生活水平的提高
分析 和医疗技术的发展使得乳腺癌治愈率和好转率提高等
Table 2 APC analysis of breast cancer incidence and mortality in Chinese
females from 1990 to 2019 有关。
发病偏差系数 死亡偏差系数 综上所述,中国女性 1990—2019 年乳腺癌发病和
项目
(95%CI) (95%CI)
死亡风险呈逐年上升趋势,年龄效应和队列效应是乳
年龄(岁)
腺癌发病和死亡的主要影响因素,提示应进一步加强
15~19 -1.69(-1.99,-1.40)-1.52(-1.94,-1.10)
≥ 40 岁年龄段女性的乳腺癌筛查和早诊早治工作,提
20~24 -0.97(-1.16,-0.78)-0.87(-1.14,-0.61)
升诊断技术和治疗水平,构建和谐的社会环境。另外,
25~29 -0.14(-0.27,-0.01)-0.13(-0.31,0.06)
本研究还存在的局限性及其处理方式包括:(1)APC
30~34 0.50(0.40,0.60) 0.59(0.45,0.72)
模型的年龄、时期和队列变量存在完全共线性,本研究
35~39 0.81(0.72,0.89) 0.83(0.72,0.94)
40~44 1.04(0.97,1.11) 0.89(0.80,0.98) 所用的网页模型已通过内生因子法(intrinsic estimator,
45~49 1.02(0.96,1.08) 0.83(0.76,0.91) IE)解决共线性问题;(2)APC 模型出生队列计算后
50~54 0.82(0.77,0.86) 0.71(0.65,0.77) 具有重叠现象,本研究通过取各个出生队列的中间值加
55~59 0.58(0.53,0.62) 0.48(0.44,0.53) 以避免;(3)该数据库未提供乳腺癌的城乡数据,因
60~64 0.30(0.26,0.34) 0.13(0.09,0.17) 而无法深入分析城乡间乳腺癌的流行趋势差异,未来还
65~69 0(-0.04,0.05) -0.16(-0.20,-0.11) 会继续关注相关研究。
70~74 -0.37(-0.43,-0.32)-0.39(-0.45,-0.34)
作者贡献:刘雪薇负责数据分析、论文撰写;王媛
75~79 -0.73(-0.79,-0.66)-0.61(-0.68,-0.54)
负责研究指导、论文修改;韦丹梅负责数据整理、统计
≥ 80 -1.16(-1.24,-1.08)-0.78(-0.87,-0.70)
指导;芦文丽负责质量控制和审校。
队列(年)
本文无利益冲突。
1910—1914 -0.04(-0.31,0.23) -0.41(-0.60,-0.22)
参考文献
1915—1919 -0.11(-0.28,-0.06)-0.34(-0.47,-0.21)
[1]SUNG H,FERLAY J,SIEGEL R L,et al. Global Cancer Statistics
1920—1924 -0.12(-0.24,-0.01)-0.26(-0.36,-0.16)
2020:GLOBOCAN estimates of incidence and mortality worldwide
1925—1929 -0.09(-0.18,-0.01)-0.15(-0.23,-0.07)
for 36 cancers in 185 countries[J]. CA Cancer J Clin,2021,71(3):
1930—1934 -0.05(-0.12,0.01) -0.05(-0.11,0.01)
209-249. DOI:10.3322/caac.21660.
1935—1939 -0.01(-0.06,0.05) 0.03(-0.01,0.08)
[2]闵淑慧,胡依,郭芮绮,等 . 1990—2019 年中国女性乳腺癌疾
1940—1944 0.01(-0.04,0.06) 0.08(0.04,0.12) 病负担及变化趋势分析[J]. 现代预防医学,2021,48(16):
1945—1949 0.06(0.02,0.11) 0.14(0.09,0.18) 2941-2945.
1950—1954 0.13(0.09,0.17) 0.21(0.16,0.25) MIN S H,HU Y,GUO R Q,et al. Analysis of burden and changing
1955—1959 0.11(0.07,0.16) 0.18(0.13,0.24) trends of breast cancer in women in China from 1990 to 2019[J].
1960—1964 0.07(0.02,0.12) 0.12(0.05,0.19) Modern Preventive Medicine,2021,48(16):2941-2945.
1965—1969 0.03(-0.03,0.08) 0.08(0.00,0.16) [3]张雪峰 . 年龄 - 时期 - 队列模型[J]. 东南大学学报(医学版),
1970—1974 -0.04(-0.10,0.03) 0(-0.10,0.10) 2001,20(3):200-203.
ZHANG X F. Age-period-cohort model[J]. Journal of Southeast
1975—1979 -0.03(-0.11,0.05) -0.03(-0.15,0.09)
University(Medical Science Edition),2001,20(3):200-
1980—1984 -0.01(-0.11,0.09) -0.05(-0.21,0.10)
203.
1985—1989 -0.04(-0.16,0.09) -0.12(-0.33,0.08)
[4]GBD 2016 DALYs and HALE Collaborators. Global,regional,and
1990—1994 -0.09(-0.29,0.11) -0.20(-0.53,0.13)
national disability-adjusted life-years(DALYs) for 333 diseases
1995—1999 -0.11(-0.52,0.30) -0.25(-0.98,0.47)
and injuries and healthy life expectancy(HALE) for 195 countries
2000—2004 -0.13(-1.05,0.79) -0.30(-1.99,1.39)
and territories,1990—2016:a systematic analysis for the Global
净漂移值(95%CI)(%) 2.58(2.34,2.83) -0.75(-1.09,-0.41)
Burden of Disease Study 2016[J]. Lancet,2017,390(10100):
P 值 1260-1344. DOI:10.1016/S0140-6736(17)32130-X.
净漂移值 =0 <0.001 <0.001 [5]GBD 2016 Causes of Death Collaborators. Global,regional,and
总局部漂移值 = 净漂 <0.001 <0.001 national age-sex specific mortality for 264 causes of death,1980—
移值
2016:a systematic analysis for the Global Burden of Disease Study
总年龄偏差 =0 <0.001 <0.001 2016[J]. Lancet,2017,390(10100):1151-1210. DOI:
总时期偏差 =0 0.607 0.180 10.1016/S0140-6736(17)32152-9.
总队列偏差 =0 <0.001 <0.001 [6]GBD 2016 Risk Factors Collaborators. Global,regional,and national
注:APC= 年龄 - 时期 - 队列 comparative risk assessment of 84 behavioural,environmental and