Page 29 - 中国全科医学2022-16期
P. 29

·1946· http://www.chinagp.net   E-mail:zgqkyx@chinagp.net.cn


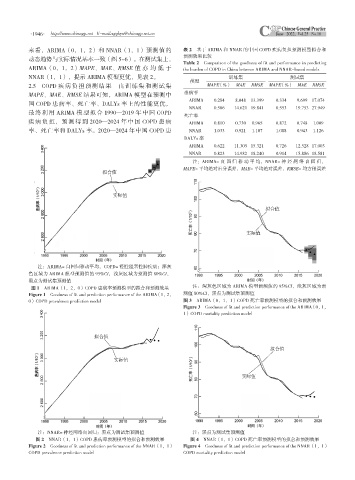
           来看,ARIMA(0,1,2)和 NNAR(1,1)预测值的                      表 2 基于 ARIMA 和 NNAR 的中国 COPD 疾病负担预测模型拟合和
                                                               预测效果比较
           动态趋势与实际情况基本一致(图 5~6)。在测试集上,
                                                               Table 2 Comparison of the goodness of fit and performance in predicting
           ARIMA(0,1,2)MAPE、MAE、RMSE 值亦均低于                     the burden of COPD in China between ARIMA and NNAR-based models
           NNAR(1,1),提示 ARIMA 模型更优,见表 2。                                      训练集                  测试集
                                                                 模型
           2.5 COPD 疾病负担预测结果 由训练集和测试集                                  MAPE(%) MAE    RMSE  MAPE(%) MAE   RMSE
           MAPE、MAE、RMSE 结果可知,ARIMA 模型在预测中                     患病率
                                                                 ARIMA   0.284  8.048  13.399  0.334  9.699 17.074
           国 COPD 患病率、死亡率、DALYs 率上的性能更优,
                                                                 NNAR    0.506  14.621 19.841  0.553  19.753 27.949
           最终利用 ARIMA 模型拟合 1990—2019 年中国 COPD
                                                               死亡率
           疾病负担,预测得到 2020—2024 年中国 COPD 患病                       ARIMA   0.810  0.730  0.965  0.872  0.748  1.009
           率、死亡率和 DALYs 率。2020—2024 年中国 COPD 患                   NNAR    1.033  0.921  1.107  1.088  0.943  1.126
                                                               DALYs 率
                                                                 ARIMA   0.622  11.305 15.321  0.726  12.528 17.003
                                                                 NNAR    0.823  14.982 18.240  0.914  15.886 18.581
                                                                  注:ARIMA= 自 回 归 移 动 平 均,NNAR= 神 经 网 络 自 回 归,
                                                               MAPE= 平均绝对百分误差,MAE= 平均绝对误差,RMSE= 均方根误差
                                    拟合值


                                       实际值

                                                                                          拟合值


                                                                                    实际值


              注:ARIMA= 自回归移动平均,COPD= 慢性阻塞性肺疾病;深灰
           色区域为 ARIMA 模型预测值的 95%CI,浅灰区域为预测值 80%CI,
           黑点为测试集预测值
           图 1 ARIMA(1,2,0)COPD 患病率预测模型的拟合和预测效果                   注:深灰色区域为 ARIMA 模型预测值的 95%CI,浅灰区域为预
           Figure 1 Goodness of fit and prediction performance of the ARIMA(1,2,  测值 80%CI,黑点为测试集预测值
           0)COPD prevalence prediction model                  图 3 ARIMA(0,1,1)COPD 死亡率预测模型的拟合和预测效果
                                                               Figure 3 Goodness of fit and prediction performance of the ARIMA(0,1,
                                                               1)COPD mortality prediction model


                                 拟合值

                                                                                            拟合值
                                       实际值


                                                                                  实际值


              注:NNAR= 神经网络自回归;黑点为测试集预测值                           注:黑点为测试集预测值
             图 2 NNAR(1,1)COPD 患病率预测模型的拟合和预测效果                   图 4 NNAR(1,1)COPD 死亡率预测模型的拟合和预测效果
           Figure 2 Goodness of fit and prediction performance of the NNAR(1,1)  Figure 4 Goodness of fit and prediction performance of the NNAR(1,1)
           COPD prevalence prediction model                    COPD mortality prediction model
   24   25   26   27   28   29   30   31   32   33   34