
Page 103 - 中国全科医学2022-15
P. 103
·1892· http://www.chinagp.net E-mail:zgqkyx@chinagp.net.cn
2
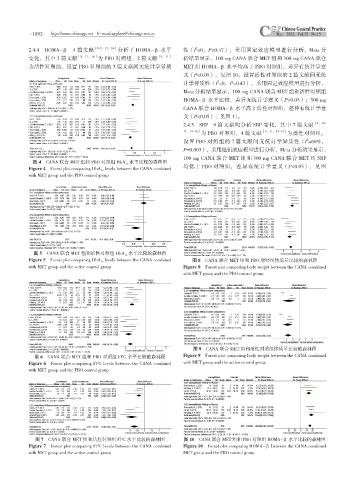
2.4.4 HOMA-β 4 篇文献 [8-9,11,16] 分析了 HOMA-β 水平 性(I =0,P=0.47),采用固定效应模型进行分析,Meta 分
变化,其中 3 篇文献 [8,11,16] 为 PBO 对照组,2 篇文献 [9,11] 析结果显示,100 mg CANA 联合 MET 组和 300 mg CANA 联合
为活性对照组。设置 PBO 对照组的 3 篇文献间无统计学异质 MET 组 HOMA-β 水平均高于 PBO 对照组,差异有统计学意
义(P<0.05),见图 10。设置活性对照组的 2 篇文献间无统
2
计学异质性(I =0,P=0.43),采用固定效应模型进行分析,
Meta 分析结果显示,100 mg CANA 联合 MET 组和活性对照组
HOMA-β 水平比较,差异无统计学意义(P>0.05);300 mg
CANA 联合 HOMA-β 水平高于活性对照组,差异有统计学意
义(P<0.05),见图 11。
2.4.5 SBP 9 篇文献均分析 SBP 变化,其中 7 篇文献 [8,10-
12,14-16] 为 PBO 对照组,4 篇文献 [9,11,13-14] 为活性对照组。
2
设置 PBO 对照组的 7 篇文献间无统计学异质性(I =60%,
P=0.003),采用随机效应模型进行分析,Meta 分析结果显示,
100 mg CANA 联合 MET 组和 300 mg CANA 联合 MET 组 SBP
图 4 CANA 联合 MET 组和 PBO 对照组 HbA 1c 水平比较的森林图
Figure 4 Forest plot comparing HbA 1c levels between the CANA combined 均低于 PBO 对照组,差异有统计学意义(P<0.05),见图
with MET group and the PBO control group
图 5 CANA 联合 MET 组和活性对照组 HbA 1c 水平比较的森林图
Figure 5 Forest plot comparing HbA 1c levels between the CANA combined 图 8 CANA 联合 MET 组和 PBO 对照组体质量比较的森林图
with MET group and the active control group Figure 8 Forest plot comparing body weight between the CANA combined
with MET group and the PBO control group
图 9 CANA 联合 MET 组和活性对照组体质量比较的森林图
图 6 CANA 联合 MET 组和 PBO 对照组 FPG 水平比较的森林图 Figure 9 Forest plot comparing body weight between the CANA combined
Figure 6 Forest plot comparing FPG levels between the CANA combined with MET group and the active control group
with MET group and the PBO control group
图 7 CANA 联合 MET 组和活性对照组 FPG 水平比较的森林图 图 10 CANA 联合 MET 组和 PBO 对照组 HOMA-β 水平比较的森林图
Figure 7 Forest plot comparing FPG levels between the CANA combined Figure 10 Forest plot comparing HOMA-β between the CANA combined
with MET group and the active control group MET group and the PBO control group