
Page 106 - 中国全科医学2022-01
P. 106
http://www.chinagp.net E-mail:zgqkyx@chinagp.net.cn ·231·
P=0.88,故均采用固定效应模型进行 Meta 分析。结果显示, 33.76),P<0.05〕高于对照组,差异有统计学意义,见表 4。
试验组患者腹胀发生率〔RR=5.95,95%CI(1.79,19.77), 2.4 敏感性分析 根据相关气管插管率指标的 Meta 分析森林
P<0.05〕、面部皮肤受损发生率〔RR=8.04,95%CI(1.92, 图显示,纳入研究中有 1 项 [21] 研究明显游离在整体趋势之外,
删除该项研究,合并结果无明显变化,可认为纳入研究稳定
数据库检索相关文献(n=8 797):PubMed(n=248), 性较好。
The Cochrane Library(n=139),Springer(n=103), 通过其他 2.5 TSA 分析
资源获得
Medline(n=114),Web of Science(n=382), 中 国 知 的文献
网(n=922),维普网(n=104),万方数据知识服务平 (n=10) 2.5.1 试验组与对照组的 pH 值比较 两组 pH 值比较的 TSA
台(n=4 121),中国生物医学文献数据库(n=2 664) 分析结果如图 7 所示,CELIKEL 等 [21] 之前的累积研究 Z 值
穿过了传统界值同时也跨过了 TSA 界值,表示在尚未达到预
剔重后获得文献(n=2 000) 期信息量之前已获得了肯定的结论,即 BiPAP 治疗能明显改
对题目、摘要筛选后获得文献(n=765)
全文评价后排除文献(n=673):综述(n=56),
会议摘要(n=35),非双水平正压通气干预
(n=367),未找到全文(n=198),数据缺失(n=17)
对全文评价后纳入文献(n=92)
文章质量初步筛出后排除文献(n=82)
最终 Meta 分析纳入文献(n=10)
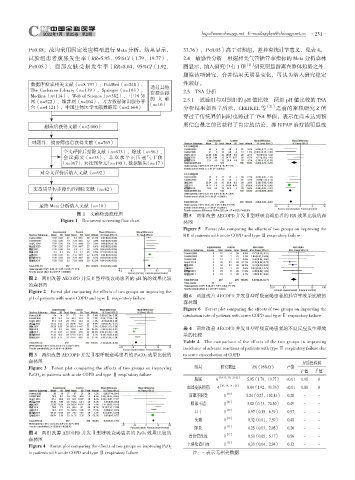
图 1 文献筛选流程图 图 5 两组改善 AECOPD 并发Ⅱ型呼吸衰竭患者的 RR 效果比较的森
Figure 1 Document screening flow chart 林图
Figure 5 Forest plot comparing the effects of two groups on improving the
RR of patients with acute COPD and type Ⅱ respiratory failure
图 2 两组改善 AECOPD 并发Ⅱ型呼吸衰竭患者的 pH 值的效果比较
的森林图
Figure 2 Forest plot comparing the effects of two groups on improving the
pH of patients with acute COPD and type Ⅱ respiratory failure 图 6 两组改善 AECOPD 并发Ⅱ型呼吸衰竭患者的插管率效果比较的
森林图
Figure 6 Forest plot comparing the effects of two groups on improving the
intubation rate of patients with acute COPD and type Ⅱ respiratory failure
表 4 两组改善 AECOPD 并发Ⅱ型呼吸衰竭患者的不良反应发生率效
果的比较
Table 4 The comparison of the effects of the two groups in improving
incidence of adverse reactions of patients with type Ⅱ respiratory failure due
图 3 两组改善 AECOPD 并发Ⅱ型呼吸衰竭患者的 PaCO 2 效果比较的 to acute exacerbation of COPD
森林图 异质性检验
Figure 3 Forest plot comparing the effects of two groups on improving 结局 研究数量 RR(95%CI) P 值 P 值 I 值
2
PaCO 2 in patients with acute COPD and type Ⅱ respiratory failure
腹胀 6 [10-11,19,21-23] 5.95(1.79,19.77) <0.01 0.98 0
面部皮肤损伤 4 [10,19,21,22] 8.04(1.92,33.76) <0.01 0.88 0
面罩不耐受 1 [10] 5.24(0.27,102.81) 0.28 - -
眼部不适 1 [22] 3.00(0.13,70.30) 0.49 - -
口干 1 [19] 0.97(0.15,6.39) 0.97 - -
头痛 1 [19] 0.32(0.01,7.59) 0.48 - -
肺炎 1 [11] 0.25(0.03,2.05) 0.20 - -
图 4 两组改善 AECOPD 并发Ⅱ型呼吸衰竭患者的 PaO 2 效果比较的 [17]
森林图 胃食管反流 1 [11] 0.50(0.05,5.17) 0.56 - -
Figure 4 Forest plot comparing the effects of two groups on improving PaO 2 上消化道出血 1 0.33(0.04,2.94) 0.32 - -
in patients with acute COPD and type Ⅱ respiratory failure 注:- 表示无相关数据