Page 55 - 中国全科医学2022-08
P. 55

·948· http://www.chinagp.net   E-mail:zgqkyx@chinagp.net.cn


           2.4 两组小鼠肠道菌群 Beta 多样性指数组间差异分                        丰度高于 DZ 组,差异有统计学意义(P 均 <0.05),见
           析 PCoA 图显示,MX 组与 DZ 组样本基本上分别聚                       图 7。
           集在不同的象限,相距较远,样本间多样性差异较大                                 在属水平,共有 27 类菌的丰度在两组小鼠肠道菌
           (t=22.444,P=0.004),见图 5。                            群内有差异(P 均 <0.05)。丰度较高的前 10 位肠道菌
           2.5 两组小鼠肠道菌群组间差异物种分析                                群:MX 组普雷沃菌科 _UCG-003(Prevotellaceae_UCG-
           2.5.1 两组小鼠肠道菌群组间与组内差异性分析                            003)、拟杆菌属(Bacteroides)、毛螺菌科 NK4A136
           Anosim 相似性分析结果显示,两组小鼠肠道菌群差                          组(Lachnospiraceae_NK4A136_group)、 瘤 胃 球 菌 属
           异组间大于组内,差异有统计学意义(R=0.476,                          (Ruminococcus)、普雷沃菌科 _UCG-001(Prevotellaceae_
           P=0.001),见图 6。                                      UCG-001)、普雷沃菌属(Prevotella)、大肠埃希菌
           2.5.2 肠道菌群差异物种分析 在门水平,MX 组未明                       (Colidextribacter)、毛螺菌科 _UCG-006(Lachnospiraceae_
           确细菌(Unidentified_ Bacteria)、蓝细菌(Cyanobacteria)、     UCG-006)丰度高于 DZ 组,罗姆布茨菌(Romboutsia)、
           易感微生物(Elusimicrobia)、弯曲杆菌(Campilobacterota)         土杆菌属(Turicibacter)丰度低于 DZ 组,差异有统计
                                                               学意义(P<0.05),见图 8。
                                                               2.5.3 两组小鼠肠道菌群 LEfSe 分析 LEfSe 分析结果
                                                               显示,两组共有 21 种肠道菌群丰度有差异,其中梭状
                                                               芽孢杆菌纲(Clostridia)、普雷沃菌科(Prevotellaceae)、


                                                                   1 000                                MX1
                                                                                                        MX2
                                                                                                        MX3
                                                                                                        MX4
                                                                                                        MX5
                                                                                                        MX6
                                                                                                        MX7
                                                                    800                                 MX8
                                                                                                        MX9
                                                                                                        MX10
                                                                                                        DZ1
                                                                                                        DZ2
                                                                                                        DZ3
                                                                                                        DZ4
                                                                                                        DZ5
                                                                    600
                                                                                                        DZ6
                                                                  OTU 数量                                DZ8
                                                                                                        DZ7
                                                                                                        DZ9
                                                                                                        DZ10
                       图 2 两组小鼠肠道菌群 Venn 图                          400
            Figure 2 Venn diagram of intestinal flora between two groups of mice
               1.00                                                 200
                                                     其他
                                                     酸杆菌门
               0.75                                  蓝细菌             0
                                                     绿弯菌门
                                                     放线菌门
                                                     脱硫菌门               0     10 000  20 000  30 000  40 000
                                                     未明确细菌          A               序列数据量
                                                     疣微菌门
              相对丰度  0.50                             拟杆菌门
                                                     变形菌门
                                                     厚壁菌门
               0.25                                               600      MX 组
                                                                           DZ 组
                                                                  500
                 0
                         MX 组               DZ 组
                                   组别                             400
                 图 3 两组小鼠肠道菌群门水平物种相对丰度柱状图
           Figure 3 Relative abundance of species at phylum level intestinal flora of   观察物种数  300
           mice between two groups
                                                                  200
                 表 1 两组小鼠肠道菌群 Shannon 指数比较( ±s)
           Table 1 Shannon Diversity Index analysis of intestinal flora between two   100
           groups of mice
                 组别           只数            Shannon 指数              0
                 DZ 组          10           5.807±0.461               0      10 000   20 000   30 000   40 000
                                                                   B
                 MX 组          10           4.549±1.450                            序列数据量
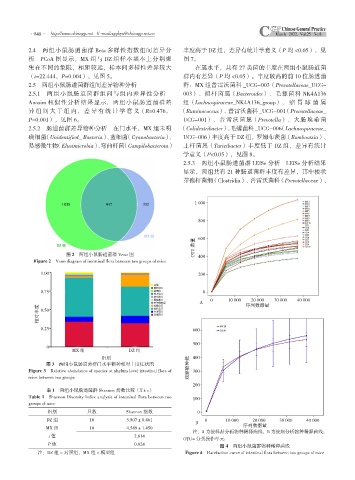
                                                                  注:A 为按样品分析物种稀释曲线,B 为按组分析物种稀释曲线;
                 t 值                          2.614
                                                               OTU= 分类操作单元
                 P 值                          0.024                        图 4 两组小鼠菌群物种稀释曲线
              注:DZ 组 = 对照组,MX 组 = 模型组                          Figure 4 Rarefaction curve of intestinal flora between two groups of mice
   50   51   52   53   54   55   56   57   58   59   60