
Page 99 - 中国全科医学2022-01
P. 99
·224· http://www.chinagp.net E-mail:zgqkyx@chinagp.net.cn
表 5 不同缺失值处理方法在外部验证的结果
Table 5 The results of external validation of different missing value processing methods
AUC 准确率 精确率 召回率 F1 值
处理方法
( ±s) 95%CI ( ±s) 95%CI ( ±s) 95%CI ( ±s) 95%CI ( ±s) 95%CI
Not 0.724±0.070 (0.723,0.725) 0.689±0.070 (0.688,0.691) 0.676±0.083 (0.674,0.677) 0.751±0.098 (0.749,0.753) 0.707±0.073 (0.705,0.708)
Random Forest 0.682±0.068 (0.681,0.684) 0.640±0.063 (0.638,0.641) 0.630±0.074 (0.628,0.631) 0.722±0.101 (0.720,0.724) 0.668±0.072 (0.667,0.669)
Random Forest Improve 0.681±0.069 (0.680,0.683) 0.642±0.063 (0.640,0.643) 0.632±0.076 (0.631,0.634) 0.720±0.101 (0.718,0.722) 0.669±0.073 (0.667,0.670)
Simple 0.679±0.068 (0.677,0.680) 0.642±0.064 (0.641,0.644) 0.634±0.079 (0.633,0.636) 0.720±0.104 (0.718,0.722) 0.669±0.073 (0.668,0.671)
P 值 <0.000 1 <0.000 1 <0.000 1 <0.000 1 <0.000 1
注:Not= 不填充,Random Forest= 随机森林填充,Random Forest Improve= 改良的随机森林填充,Simple= 简单填充
表 6 不同特征筛选方法在外部验证的结果
Table 6 The results of external validation of different feature screening methods
AUC 准确率 精确率 召回率 F1Score
筛选方法
( ±s) 95%CI ( ±s) 95%CI ( ±s) 95%CI ( ±s) 95%CI ( ±s) 95%CI
Boruta 0.681±0.072 (0.680,0.682) 0.652±0.068 (0.650,0.653) 0.643±0.081 (0.641,0.644) 0.722±0.100 (0.721,0.724) 0.676±0.073 (0.674,0.677)
Lasso 0.703±0.069 (0.701,0.704) 0.651±0.069 (0.649,0.652) 0.643±0.082 (0.642,0.644) 0.717±0.110 (0.715,0.719) 0.672±0.079 (0.671,0.674)
Not 0.691±0.071 (0.690,0.692) 0.658±0.068 (0.656,0.659) 0.643±0.078 (0.642,0.645) 0.745±0.094 (0.743,0.746) 0.687±0.071 (0.686,0.688)
Pvalue <0.000 1 <0.000 1 0.534 4 <0.000 1 <0.000 1
注:Not= 不筛选,Lasso=Lasso 筛选,Boruta=Boruta 筛选
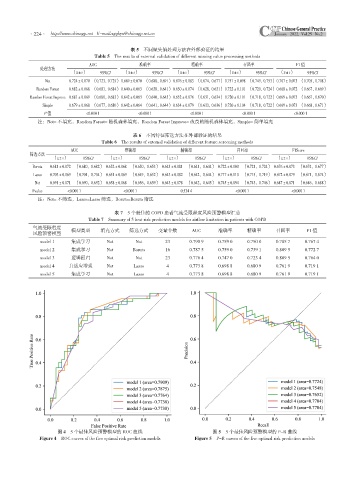
表 7 5 个最佳的 COPD 患者气流受限程度风险预警模型汇总
Table 7 Summary of 5 best risk prediction models for airflow limitation in patients with COPD
气流受限程度
风险预警模型 模型类型 填充方式 筛选方式 变量个数 AUC 准确率 精确率 召回率 F1 值
model 1 集成学习 Not Not 23 0.790 9 0.759 0 0.750 0 0.785 7 0.767 4
model 2 集成学习 Not Boruta 16 0.787 5 0.759 0 0.739 1 0.809 5 0.772 7
model 3 逻辑回归 Not Not 23 0.776 4 0.747 0 0.723 4 0.809 5 0.764 0
model 4 自适应增强 Not Lasso 4 0.773 8 0.698 8 0.680 9 0.761 9 0.719 1
model 5 集成学习 Not Lasso 4 0.773 8 0.698 8 0.680 9 0.761 9 0.719 1
图 4 5 个最佳风险预警模型的 ROC 曲线 图 5 5 个最佳风险预警模型的 P-R 曲线
Figure 4 ROC curves of the five optimal risk prediction models Figure 5 P-R curves of the five optimal risk prediction models