
Page 98 - 中国全科医学2022-01
P. 98
http://www.chinagp.net E-mail:zgqkyx@chinagp.net.cn ·223·
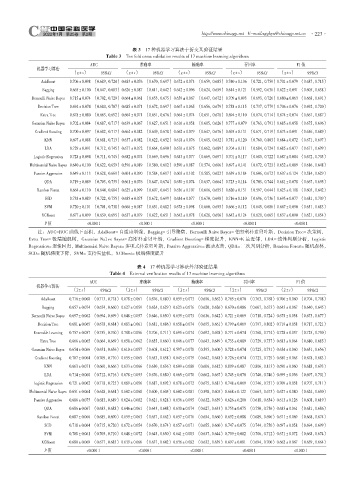
表 3 17 种机器学习算法十折交叉验证结果
Table 3 Ten fold cross validation results of 17 machine learning algorithms
AUC 准确率 精确率 召回率 F1 值
机器学习算法
( ±s) 95%CI ( ±s) 95%CI ( ±s) 95%CI ( ±s) 95%CI ( ±s) 95%CI
AdaBoost 0.706±0.098 (0.689,0.724) 0.683±0.076 (0.670,0.697) 0.672±0.073 (0.659,0.685) 0.740±0.106 (0.721,0.759)0.701±0.079 (0.687,0.715)
Bagging 0.665±0.100 (0.647,0.683) 0.626±0.087 (0.611,0.642) 0.642±0.096 (0.624,0.659) 0.614±0.121 (0.592,0.636)0.622±0.091 (0.605,0.638)
Bernoulli Naive Bayes 0.715±0.074 (0.702,0.729) 0.664±0.061 (0.653,0.675) 0.659±0.067 (0.647,0.672) 0.709±0.093 (0.693,0.726)0.680±0.063 (0.668,0.691)
Decision Tree 0.694±0.074 (0.680,0.707) 0.685±0.071 (0.672,0.697) 0.667±0.065 (0.656,0.679) 0.758±0.115 (0.737,0.779)0.706±0.076 (0.692,0.720)
Extra Tree 0.678±0.080 (0.663,0.692) 0.664±0.071 (0.651,0.676) 0.664±0.074 (0.651,0.678) 0.694±0.110 (0.674,0.714)0.674±0.074 (0.661,0.687)
Gaussian Naive Bayes 0.702±0.084 (0.687,0.717) 0.639±0.067 (0.627,0.651) 0.616±0.058 (0.605,0.626) 0.777±0.079 (0.763,0.791)0.685±0.058 (0.675,0.696)
Gradient Boosting 0.700±0.097 (0.682,0.717) 0.664±0.082 (0.649,0.678) 0.662±0.079 (0.647,0.676) 0.695±0.131 (0.671,0.719)0.673±0.091 (0.656,0.689)
KNN 0.697±0.088 (0.681,0.713) 0.637±0.082 (0.622,0.652) 0.618±0.076 (0.605,0.632) 0.781±0.120 (0.760,0.803)0.684±0.072 (0.671,0.697)
LDA 0.729±0.091 (0.712,0.745) 0.677±0.072 (0.664,0.690) 0.676±0.075 (0.662,0.689) 0.704±0.111 (0.684,0.724)0.685±0.077 (0.671,0.699)
Logistic Regression 0.728±0.094 (0.711,0.745) 0.682±0.074 (0.669,0.696) 0.683±0.077 (0.669,0.697) 0.701±0.117 (0.680,0.722)0.687±0.084 (0.672,0.703)
Multinomial Naive Bayes 0.640±0.100 (0.622,0.659) 0.596±0.089 (0.580,0.612) 0.590±0.087 (0.574,0.606) 0.697±0.141 (0.672,0.723)0.632±0.089 (0.616,0.648)
Passive Aggressive 0.649±0.113 (0.628,0.669) 0.601±0.090 (0.584,0.617) 0.603±0.102 (0.585,0.622) 0.639±0.184 (0.606,0.672)0.607±0.124 (0.584,0.629)
QDA 0.719±0.089 (0.703,0.735) 0.661±0.076 (0.647,0.674) 0.650±0.074 (0.637,0.664) 0.723±0.114 (0.703,0.744)0.681±0.078 (0.667,0.695)
Random Forest 0.664±0.110 (0.644,0.684) 0.625±0.099 (0.607,0.643) 0.636±0.107 (0.616,0.655) 0.620±0.131 (0.597,0.644)0.623±0.108 (0.603,0.642)
SGD 0.738±0.089 (0.722,0.755) 0.685±0.075 (0.672,0.699) 0.684±0.077 (0.670,0.698) 0.716±0.110 (0.696,0.736)0.695±0.077 (0.681,0.709)
SVM 0.720±0.101 (0.701,0.738) 0.666±0.087 (0.651,0.682) 0.678±0.098 (0.660,0.695) 0.666±0.112 (0.645,0.686)0.667±0.090 (0.651,0.683)
XGBoost 0.677±0.099 (0.659,0.695) 0.637±0.079 (0.622,0.651) 0.642±0.078 (0.628,0.656) 0.642±0.124 (0.620,0.665)0.637±0.090 (0.621,0.654)
P 值 <0.000 1 <0.000 1 <0.000 1 <0.000 1 <0.000 1
注:AUC=ROC 曲线下面积,AdaBoost= 自适应增强,Bagging= 引导聚集,Bernoulli Naive Bayes= 伯努利朴素贝叶斯,Decision Tree= 决策树,
Extra Tree= 极端随机树,Gaussian Naïve Bayes= 高斯朴素贝叶斯,Gradient Boosting= 梯度提升,KNN=K 最近邻,LDA= 线性判别分析,Logistic
Regression= 逻辑回归,Multinomial Naive Bayes= 多项式朴素贝叶斯,Passive Aggressive= 被动攻击,QDA= 二次判别分析,Random Forest= 随机森林,
SGD= 随机梯度下降,SVM= 支持矢量机,XGBoost= 极端梯度提升
表 4 17 种机器学习算法外部验证结果
Table 4 External verification results of 17 machine learning algorithms
AUC 准确率 精确率 召回率 F1 值
机器学习算法
( ±s) 95%CI ( ±s) 95%CI ( ±s) 95%CI ( ±s) 95%CI ( ±s) 95%CI
AdaBoost 0.716±0.068 (0.713,0.718) 0.678±0.061 (0.676,0.680) 0.659±0.073 (0.656,0.662) 0.765±0.070 (0.763,0.768)0.706±0.060 (0.704,0.708)
Bagging 0.657±0.074 (0.654,0.660) 0.627±0.059 (0.624,0.629) 0.623±0.076 (0.620,0.626) 0.670±0.086 (0.667,0.673)0.643±0.067 (0.640,0.645)
Bernoulli Naive Bayes 0.697±0.062 (0.694,0.699) 0.648±0.057 (0.646,0.650) 0.639±0.073 (0.636,0.642) 0.721±0.069 (0.718,0.724)0.675±0.058 (0.673,0.677)
Decision Tree 0.681±0.065 (0.678,0.684) 0.683±0.061 (0.681,0.686) 0.658±0.074 (0.655,0.661) 0.799±0.069 (0.797,0.802)0.719±0.058 (0.717,0.721)
Ensemble Learning 0.757±0.057 (0.755,0.760) 0.708±0.056 (0.706,0.711) 0.695±0.074 (0.692,0.698) 0.771±0.074 (0.768,0.774)0.728±0.057 (0.725,0.730)
Extra Tree 0.666±0.065 (0.664,0.669) 0.658±0.062 (0.655,0.660) 0.646±0.077 (0.643,0.649) 0.733±0.089 (0.729,0.737)0.683±0.064 (0.680,0.685)
Gaussian Naive Bayes 0.654±0.066 (0.651,0.656) 0.610±0.057 (0.608,0.612) 0.597±0.070 (0.595,0.600) 0.728±0.074 (0.725,0.731)0.654±0.060 (0.651,0.656)
Gradient Boosting 0.707±0.064 (0.705,0.710) 0.655±0.065 (0.653,0.658) 0.645±0.079 (0.642,0.648) 0.726±0.074 (0.723,0.729)0.680±0.065 (0.678,0.683)
KNN 0.663±0.071 (0.660,0.666) 0.633±0.066 (0.630,0.636) 0.609±0.080 (0.606,0.612) 0.809±0.087 (0.806,0.813)0.690±0.060 (0.688,0.693)
LDA 0.714±0.060 (0.712,0.716) 0.678±0.053 (0.676,0.680) 0.665±0.070 (0.662,0.667) 0.743±0.070 (0.740,0.746)0.699±0.056 (0.697,0.701)
Logistic Regression 0.721±0.062 (0.718,0.723) 0.689±0.056 (0.687,0.692) 0.678±0.072 (0.675,0.681) 0.748±0.069 (0.746,0.751)0.709±0.058 (0.707,0.711)
Multinomial Naive Bayes 0.651±0.064 (0.648,0.654) 0.602±0.068 (0.600,0.605) 0.602±0.081 (0.598,0.605) 0.668±0.122 (0.663,0.673)0.627±0.080 (0.624,0.630)
Passive Aggressive 0.686±0.075 (0.683,0.689) 0.624±0.082 (0.621,0.628) 0.636±0.095 (0.632,0.639) 0.626±0.200 (0.618,0.634)0.613±0.126 (0.608,0.619)
QDA 0.686±0.067 (0.683,0.688) 0.646±0.061 (0.643,0.648) 0.630±0.074 (0.627,0.633) 0.753±0.075 (0.750,0.756)0.683±0.061 (0.681,0.686)
Random Forest 0.687±0.066 (0.685,0.690) 0.659±0.063 (0.657,0.662) 0.657±0.076 (0.654,0.660) 0.692±0.088 (0.689,0.696)0.671±0.069 (0.668,0.674)
SGD 0.718±0.064 (0.715,0.720) 0.672±0.054 (0.670,0.674) 0.657±0.071 (0.655,0.660) 0.747±0.075 (0.744,0.750)0.697±0.058 (0.694,0.699)
SVM 0.708±0.061 (0.705,0.710) 0.648±0.072 (0.645,0.650) 0.641±0.083 (0.637,0.644) 0.709±0.082 (0.706,0.712)0.671±0.072 (0.668,0.674)
XGBoost 0.680±0.069 (0.677,0.683) 0.639±0.066 (0.637,0.642) 0.636±0.082 (0.632,0.639) 0.697±0.081 (0.694,0.700)0.662±0.067 (0.659,0.664)
P 值 <0.000 1 <0.000 1 <0.000 1 <0.000 1 <0.000 1