
Chinese General Practice ›› 2024, Vol. 27 ›› Issue (18): 2260-2264.DOI: 10.12114/j.issn.1007-9572.2023.0773
• Article·Epidemiological Study • Previous Articles Next Articles
Received:2023-11-10
Revised:2024-01-08
Published:2024-06-20
Online:2024-03-22
Contact:
LYU Juncheng
通讯作者:
吕军城
作者简介:作者贡献:
苗立鹏、吕军城提出研究命题及研究思路,负责设计研究方案;苗立鹏、任柯好负责数据收集、采集、清洗和统计学分析以及图、表的制作;苗立鹏负责论文起草;李梦蝶、吕军城负责论文的修订;吕军城负责最终版本修订,对论文整体负责。
基金资助:
Add to citation manager EndNote|Ris|BibTeX
URL: https://www.chinagp.net/EN/10.12114/j.issn.1007-9572.2023.0773
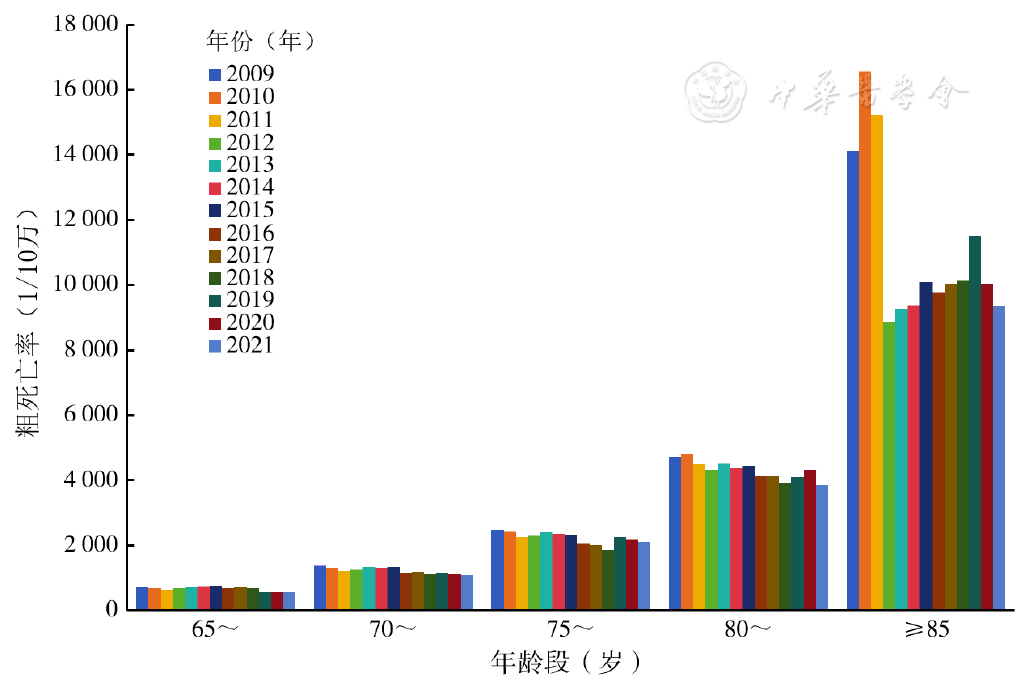
Figure 1 Crude mortality of cardiovascular disease of aged≥65 in China from 2009 to 2021
| 年份(年) | 粗死亡率 | 标化死亡率 | ||||||||||||||
|---|---|---|---|---|---|---|---|---|---|---|---|---|---|---|---|---|
| 整体 | 男性 | 女性 | 城市 | 农村 | 东部 | 中部 | 西部 | 整体 | 男性 | 女性 | 城市 | 农村 | 东部 | 中部 | 西部 | |
| 2009 | 235.83 | 255.18 | 215.68 | 222.82 | 243.01 | 242.47 | 255.74 | 201.22 | 281.82 | 336.65 | 234.43 | 225.32 | 324.22 | 255.50 | 327.23 | 266.62 |
| 2010 | 238.12 | 258.91 | 216.47 | 218.64 | 249.98 | 240.83 | 262.80 | 203.34 | 292.36 | 351.02 | 242.28 | 241.38 | 330.66 | 265.17 | 335.41 | 281.42 |
| 2011 | 242.69 | 264.80 | 219.79 | 208.44 | 265.39 | 240.87 | 266.77 | 213.09 | 273.49 | 338.83 | 220.79 | 244.96 | 294.36 | 241.57 | 318.13 | 269.51 |
| 2012 | 253.89 | 275.41 | 231.54 | 217.63 | 277.91 | 250.50 | 279.18 | 224.89 | 238.30 | 288.44 | 193.23 | 201.77 | 263.01 | 209.43 | 278.12 | 233.53 |
| 2013 | 284.81 | 306.62 | 262.17 | 263.24 | 294.48 | 296.62 | 297.79 | 247.94 | 248.91 | 295.95 | 204.95 | 214.23 | 265.92 | 227.32 | 285.40 | 235.48 |
| 2014 | 291.00 | 312.59 | 268.53 | 267.99 | 301.79 | 292.47 | 308.00 | 264.99 | 246.37 | 292.76 | 202.73 | 224.50 | 256.83 | 219.42 | 282.03 | 245.35 |
| 2015 | 295.42 | 314.73 | 275.50 | 273.03 | 306.05 | 304.33 | 313.07 | 260.09 | 250.34 | 294.03 | 208.87 | 227.73 | 261.41 | 228.38 | 284.74 | 241.75 |
| 2016 | 301.54 | 320.18 | 282.21 | 273.37 | 315.67 | 306.29 | 320.18 | 269.54 | 235.46 | 279.20 | 192.55 | 218.90 | 243.89 | 213.72 | 266.28 | 230.24 |
| 2017 | 304.11 | 323.38 | 284.19 | 275.97 | 318.47 | 305.33 | 324.08 | 274.95 | 235.84 | 280.06 | 194.03 | 218.57 | 244.82 | 209.38 | 265.19 | 243.32 |
| 2018 | 313.61 | 333.02 | 293.52 | 283.61 | 329.18 | 315.48 | 333.86 | 283.61 | 230.19 | 274.26 | 188.29 | 210.79 | 240.43 | 204.06 | 257.19 | 240.76 |
| 2019 | 317.54 | 337.59 | 296.86 | 288.34 | 332.67 | 312.43 | 342.45 | 292.67 | 238.58 | 281.47 | 197.96 | 208.84 | 254.79 | 209.68 | 270.48 | 247.24 |
| 2020 | 328.84 | 349.20 | 307.83 | 300.37 | 344.22 | 324.51 | 353.67 | 303.21 | 229.33 | 275.87 | 186.25 | 199.22 | 246.59 | 200.60 | 260.01 | 239.48 |
| 2021 | 353.31 | 375.01 | 330.92 | 315.36 | 373.09 | 344.53 | 380.45 | 332.31 | 221.24 | 267.97 | 177.48 | 192.58 | 236.52 | 196.42 | 244.10 | 234.05 |
| 年均 | 289.29 | 309.74 | 268.09 | 262.22 | 303.99 | 290.51 | 310.61 | 259.37 | 247.86 | 296.65 | 203.37 | 217.60 | 266.42 | 221.59 | 282.64 | 246.82 |
Table 1 Crude mortality rate and age-standardized mortality rate of cardiovascular disease in China from 2009 to 2021
| 年份(年) | 粗死亡率 | 标化死亡率 | ||||||||||||||
|---|---|---|---|---|---|---|---|---|---|---|---|---|---|---|---|---|
| 整体 | 男性 | 女性 | 城市 | 农村 | 东部 | 中部 | 西部 | 整体 | 男性 | 女性 | 城市 | 农村 | 东部 | 中部 | 西部 | |
| 2009 | 235.83 | 255.18 | 215.68 | 222.82 | 243.01 | 242.47 | 255.74 | 201.22 | 281.82 | 336.65 | 234.43 | 225.32 | 324.22 | 255.50 | 327.23 | 266.62 |
| 2010 | 238.12 | 258.91 | 216.47 | 218.64 | 249.98 | 240.83 | 262.80 | 203.34 | 292.36 | 351.02 | 242.28 | 241.38 | 330.66 | 265.17 | 335.41 | 281.42 |
| 2011 | 242.69 | 264.80 | 219.79 | 208.44 | 265.39 | 240.87 | 266.77 | 213.09 | 273.49 | 338.83 | 220.79 | 244.96 | 294.36 | 241.57 | 318.13 | 269.51 |
| 2012 | 253.89 | 275.41 | 231.54 | 217.63 | 277.91 | 250.50 | 279.18 | 224.89 | 238.30 | 288.44 | 193.23 | 201.77 | 263.01 | 209.43 | 278.12 | 233.53 |
| 2013 | 284.81 | 306.62 | 262.17 | 263.24 | 294.48 | 296.62 | 297.79 | 247.94 | 248.91 | 295.95 | 204.95 | 214.23 | 265.92 | 227.32 | 285.40 | 235.48 |
| 2014 | 291.00 | 312.59 | 268.53 | 267.99 | 301.79 | 292.47 | 308.00 | 264.99 | 246.37 | 292.76 | 202.73 | 224.50 | 256.83 | 219.42 | 282.03 | 245.35 |
| 2015 | 295.42 | 314.73 | 275.50 | 273.03 | 306.05 | 304.33 | 313.07 | 260.09 | 250.34 | 294.03 | 208.87 | 227.73 | 261.41 | 228.38 | 284.74 | 241.75 |
| 2016 | 301.54 | 320.18 | 282.21 | 273.37 | 315.67 | 306.29 | 320.18 | 269.54 | 235.46 | 279.20 | 192.55 | 218.90 | 243.89 | 213.72 | 266.28 | 230.24 |
| 2017 | 304.11 | 323.38 | 284.19 | 275.97 | 318.47 | 305.33 | 324.08 | 274.95 | 235.84 | 280.06 | 194.03 | 218.57 | 244.82 | 209.38 | 265.19 | 243.32 |
| 2018 | 313.61 | 333.02 | 293.52 | 283.61 | 329.18 | 315.48 | 333.86 | 283.61 | 230.19 | 274.26 | 188.29 | 210.79 | 240.43 | 204.06 | 257.19 | 240.76 |
| 2019 | 317.54 | 337.59 | 296.86 | 288.34 | 332.67 | 312.43 | 342.45 | 292.67 | 238.58 | 281.47 | 197.96 | 208.84 | 254.79 | 209.68 | 270.48 | 247.24 |
| 2020 | 328.84 | 349.20 | 307.83 | 300.37 | 344.22 | 324.51 | 353.67 | 303.21 | 229.33 | 275.87 | 186.25 | 199.22 | 246.59 | 200.60 | 260.01 | 239.48 |
| 2021 | 353.31 | 375.01 | 330.92 | 315.36 | 373.09 | 344.53 | 380.45 | 332.31 | 221.24 | 267.97 | 177.48 | 192.58 | 236.52 | 196.42 | 244.10 | 234.05 |
| 年均 | 289.29 | 309.74 | 268.09 | 262.22 | 303.99 | 290.51 | 310.61 | 259.37 | 247.86 | 296.65 | 203.37 | 217.60 | 266.42 | 221.59 | 282.64 | 246.82 |
| 标化死亡率 | 指标 | 时间 | 变化值(95%CI)(%) | t值 | P值 |
|---|---|---|---|---|---|
| 整体 | APC | 2009—2012年 | -5.3(-9.4~-1.0) | -3.123 | 0.026 |
| 2012—2019年 | -1.0(-2.5~-0.5) | -1.673 | 0.155 | ||
| 2019—2021年 | -2.5(-10.8~6.6) | -0.727 | 0.500 | ||
| AAPC | 2009—2021年 | -1.9(-2.6~-1.2) | -6.058 | <0.001 | |
| 性别 | |||||
| 男性 | APC | 2009—2012年 | -4.9(-8.2~-1.5) | -3.695 | 0.014 |
| 2012—2016年 | -1.8(-5.2~1.7) | -1.313 | 0.246 | ||
| 2016—2021年 | -0.8(-2.4~0.7) | -1.355 | 0.233 | ||
| AAPC | 2009—2021年 | -2.0(-2.7~-1.3) | -5.980 | <0.001 | |
| 女性 | APC | 2009—2012年 | -5.8(-11.1~-0.2) | -2.642 | 0.045 |
| 2012—2019年 | -0.8(-2.7~1.1) | -1.025 | 0.352 | ||
| 2019—2021年 | -4.0(-14.6~7.8) | -0.905 | 0.406 | ||
| AAPC | 2009—2021年 | -2.1(-3.4~-1.0) | -3.536 | 0.004 | |
| 城乡 | |||||
| 城市 | APC | 2009—2012年 | -3.4(-6.1~-0.6) | -3.205 | 0.024 |
| 2012—2015年 | 1.9(-3.7~7.9) | 0.840 | 0.439 | ||
| 2015—2021年 | -2.6(-3.5~-1.6) | -6.878 | 0.001 | ||
| AAPC | 2009—2021年 | -1.3(-2.1~-0.5) | -3.462 | 0.005 | |
| 农村 | APC | 2009—2012年 | -7.0(-13.0~-0.7) | -2.855 | 0.036 |
| 2012—2016年 | -2.2(-8.4~4.5) | -0.862 | 0.428 | ||
| 2016—2021年 | -0.5(-3.4~2.5) | -0.418 | 0.693 | ||
| AAPC | 2009—2021年 | -2.4(-3.3~-1.5) | -5.672 | <0.001 | |
| 地区 | |||||
| 东部 | APC | 2009—2012年 | -6.3(-10.3~-2.2) | -3.881 | 0.012 |
| 2012—2015年 | 0.2(-8.1~9.3) | 0.074 | 0.944 | ||
| 2015—2021年 | -2.2(-3.6~-0.7) | -3.821 | 0.012 | ||
| AAPC | 2009—2021年 | -2.1(-2.9~-1.4) | -6.358 | <0.001 | |
| 中部 | APC | 2009—2012年 | -5.3(-9.0~-1.4) | -3.513 | 0.017 |
| 2012—2019年 | -1.4(-2.7~-0.1) | -2.685 | 0.044 | ||
| 2019—2021年 | -2.9(-10.4~-5.1) | -0.959 | 0.381 | ||
| AAPC | 2009—2021年 | -2.2(-2.9~-1.6) | -7.443 | <0.001 | |
| 西部 | APC | 2009—2013年 | -4.2(-9.4~1.4) | -1.906 | 0.108 |
| 2013—2019年 | 0.5(-3.4~4.5) | 0.312 | 0.768 | ||
| 2019—2021年 | -1.9(-17.9~17.1) | -0.280 | 0.750 | ||
| AAPC | 2009—2021年 | -1.0(-1.8~-0.2) | -2.777 | 0.018 |
Table 2 Trend analysis of cardiovascular disease death in China from 2009 to 2021
| 标化死亡率 | 指标 | 时间 | 变化值(95%CI)(%) | t值 | P值 |
|---|---|---|---|---|---|
| 整体 | APC | 2009—2012年 | -5.3(-9.4~-1.0) | -3.123 | 0.026 |
| 2012—2019年 | -1.0(-2.5~-0.5) | -1.673 | 0.155 | ||
| 2019—2021年 | -2.5(-10.8~6.6) | -0.727 | 0.500 | ||
| AAPC | 2009—2021年 | -1.9(-2.6~-1.2) | -6.058 | <0.001 | |
| 性别 | |||||
| 男性 | APC | 2009—2012年 | -4.9(-8.2~-1.5) | -3.695 | 0.014 |
| 2012—2016年 | -1.8(-5.2~1.7) | -1.313 | 0.246 | ||
| 2016—2021年 | -0.8(-2.4~0.7) | -1.355 | 0.233 | ||
| AAPC | 2009—2021年 | -2.0(-2.7~-1.3) | -5.980 | <0.001 | |
| 女性 | APC | 2009—2012年 | -5.8(-11.1~-0.2) | -2.642 | 0.045 |
| 2012—2019年 | -0.8(-2.7~1.1) | -1.025 | 0.352 | ||
| 2019—2021年 | -4.0(-14.6~7.8) | -0.905 | 0.406 | ||
| AAPC | 2009—2021年 | -2.1(-3.4~-1.0) | -3.536 | 0.004 | |
| 城乡 | |||||
| 城市 | APC | 2009—2012年 | -3.4(-6.1~-0.6) | -3.205 | 0.024 |
| 2012—2015年 | 1.9(-3.7~7.9) | 0.840 | 0.439 | ||
| 2015—2021年 | -2.6(-3.5~-1.6) | -6.878 | 0.001 | ||
| AAPC | 2009—2021年 | -1.3(-2.1~-0.5) | -3.462 | 0.005 | |
| 农村 | APC | 2009—2012年 | -7.0(-13.0~-0.7) | -2.855 | 0.036 |
| 2012—2016年 | -2.2(-8.4~4.5) | -0.862 | 0.428 | ||
| 2016—2021年 | -0.5(-3.4~2.5) | -0.418 | 0.693 | ||
| AAPC | 2009—2021年 | -2.4(-3.3~-1.5) | -5.672 | <0.001 | |
| 地区 | |||||
| 东部 | APC | 2009—2012年 | -6.3(-10.3~-2.2) | -3.881 | 0.012 |
| 2012—2015年 | 0.2(-8.1~9.3) | 0.074 | 0.944 | ||
| 2015—2021年 | -2.2(-3.6~-0.7) | -3.821 | 0.012 | ||
| AAPC | 2009—2021年 | -2.1(-2.9~-1.4) | -6.358 | <0.001 | |
| 中部 | APC | 2009—2012年 | -5.3(-9.0~-1.4) | -3.513 | 0.017 |
| 2012—2019年 | -1.4(-2.7~-0.1) | -2.685 | 0.044 | ||
| 2019—2021年 | -2.9(-10.4~-5.1) | -0.959 | 0.381 | ||
| AAPC | 2009—2021年 | -2.2(-2.9~-1.6) | -7.443 | <0.001 | |
| 西部 | APC | 2009—2013年 | -4.2(-9.4~1.4) | -1.906 | 0.108 |
| 2013—2019年 | 0.5(-3.4~4.5) | 0.312 | 0.768 | ||
| 2019—2021年 | -1.9(-17.9~17.1) | -0.280 | 0.750 | ||
| AAPC | 2009—2021年 | -1.0(-1.8~-0.2) | -2.777 | 0.018 |
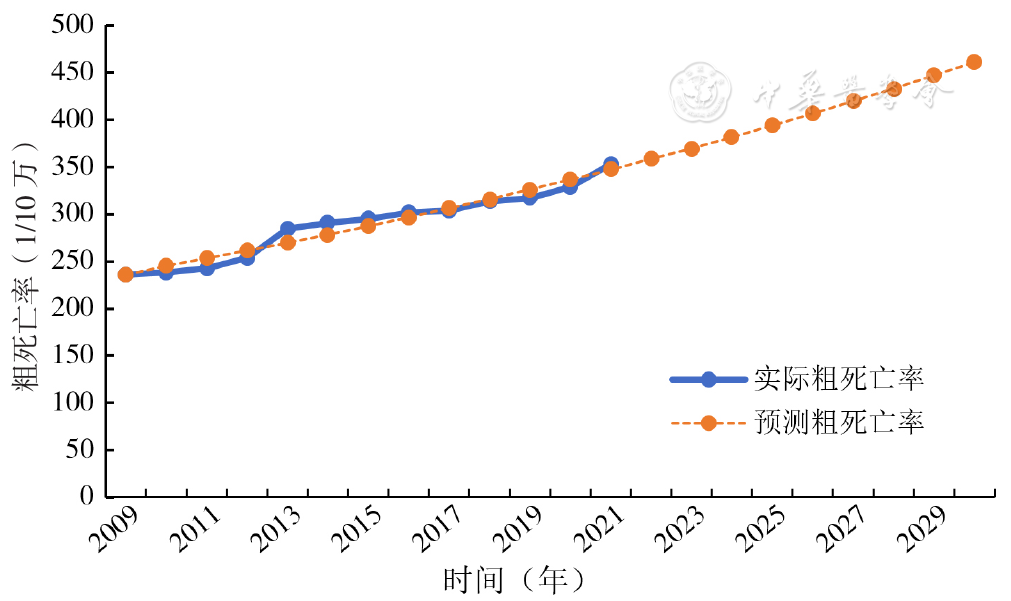
Figure 2 Time series of actual and predicted crude mortality rate of cardiovascular disease in China from 2022 to 2030
| 时间(年) | 实际值 | 预测值 | 时间(年) | 实际值 | 预测值 |
|---|---|---|---|---|---|
| 2009 | 235.83 | 235.83 | 2020 | 328.84 | 336.60 |
| 2010 | 238.12 | 245.47 | 2021 | 353.31 | 347.40 |
| 2011 | 242.69 | 253.34 | 2022 | 358.54 | |
| 2012 | 253.89 | 261.47 | 2023 | 370.04 | |
| 2013 | 284.81 | 269.85 | 2024 | 381.91 | |
| 2014 | 291.00 | 278.51 | 2025 | 394.16 | |
| 2015 | 295.42 | 287.44 | 2026 | 406.81 | |
| 2016 | 301.54 | 296.67 | 2027 | 419.85 | |
| 2017 | 304.11 | 306.18 | 2028 | 433.32 | |
| 2018 | 313.61 | 316.00 | 2029 | 447.22 | |
| 2019 | 317.54 | 326.14 | 2030 | 461.57 |
Table 3 Forecast result of crude mortality rate of cardiovascular in China from 2022 to 2030
| 时间(年) | 实际值 | 预测值 | 时间(年) | 实际值 | 预测值 |
|---|---|---|---|---|---|
| 2009 | 235.83 | 235.83 | 2020 | 328.84 | 336.60 |
| 2010 | 238.12 | 245.47 | 2021 | 353.31 | 347.40 |
| 2011 | 242.69 | 253.34 | 2022 | 358.54 | |
| 2012 | 253.89 | 261.47 | 2023 | 370.04 | |
| 2013 | 284.81 | 269.85 | 2024 | 381.91 | |
| 2014 | 291.00 | 278.51 | 2025 | 394.16 | |
| 2015 | 295.42 | 287.44 | 2026 | 406.81 | |
| 2016 | 301.54 | 296.67 | 2027 | 419.85 | |
| 2017 | 304.11 | 306.18 | 2028 | 433.32 | |
| 2018 | 313.61 | 316.00 | 2029 | 447.22 | |
| 2019 | 317.54 | 326.14 | 2030 | 461.57 |
| [1] |
World Heart Federation. World Heart Report 2023:Confronting the World's Number One Killer[R]. Geneva,Switzerland:World Heart Federation,2023:3-5.
|
| [2] |
《中国心血管健康与疾病报告2022》编写组,胡盛寿,王增武. 《中国心血管健康与疾病报告2022》概述[J]. 中国心血管病研究,2023,21(7):577-600. DOI:10.3969/j.issn.1672-5301.2023.07.001.
|
| [3] |
中国疾病预防控制中心,慢性非传染性疾病预防控制中心. 全国疾病监测系统死因监测数据集电子版下载[EB/OL]. (2021-01-11)[2023-08-28].
|
| [4] |
中国疾病预防控制中心,慢性非传染性疾病预防控制中心,国家卫生健康委统计信息中心. 中国死因监测数据集2013[M].北京:中国科学技术出版社,2014:12-13.
|
| [5] |
|
| [6] |
National Cancer Institute. Joinpointtrend analysis software(v.4.2.0.1)[EB/OL]. (2015-06-23)[2023-08-28].
|
| [7] |
段朝晖,张敏,徐杰茹,等. 2000—2019年中国脑瘤死亡趋势分析及预测研究[J]. 中国全科医学,2023,26(6):734-741. DOI:10.12114/j.issn.1007-9572.2022.0630.
|
| [8] |
|
| [9] |
刘月姣. 《中国居民营养与慢性病状况报告(2020年)》发布[J]. 中国食物与营养,2020,26(12):2. DOI:10.19870/j.cnki.11-3716/ts.2020.12.001.
|
| [10] |
World Health Organization. Cardiovascular diseases(CVDs)[EB/OL]. (2017-05-17)[2023-08-28].
|
| [11] |
蓝洋,王宏宇. 雌激素水平与血管相关疾病[J]. 心血管病学进展,2019,40(4):529-532. DOI:10.16806/j.cnki.issn.1004-3934.2019.04.010.
|
| [12] |
王燕逍翔,白建军,宇传华. 基于全球视角的中国心血管病疾病负担现状及趋势[J]. 公共卫生与预防医学,2021,32(6):6-11. DOI:10.3969/j.issn.1006-2483.2021.06.002.
|
| [13] |
习婧媛,韩颖,陈湘. 2010—2019年中国居民四类慢性非传染病的死亡趋势及差别分解分析[J]. 现代预防医学,2022,49(12):2119-2125.
|
| [14] |
|
| [15] |
|
| [16] |
王雪菲,陆英丽,孙晓翠,等. 2009—2019年中国老年人心血管疾病死亡趋势及预测分析[J]. 现代预防医学,2023,50(1):39-45. DOI:10.20043/j.cnki.MPM.202207214.
|
| [17] |
牛君义. 心脑血管疾病流行概况及主要影响因素[J]. 中西医结合心血管病电子杂志,2019,7(32):15. DOI:10.16282/j.cnki.cn11-9336/r.2019.32.012.
|
| [18] |
杜鹏. 中国人口老龄化现状与社会保障体系发展[J]. 社会科学文摘,2023(7):8-10.
|
| [19] |
吕兰婷,林筑,张延. 我国慢性病防控与管理研究的十年综述[J]. 中国卫生事业管理,2020,37(1):32-34,37.
|
| [20] |
国家心血管病医疗质量控制中心. 2022年中国心血管病医疗质量概述[J]. 中国循环杂志,2023,38(5):482-495. DOI:10.3969/j.issn.1000-3614.2023.05.002.
|
| Viewed | ||||||
|
Full text |
|
|||||
|
Abstract |
|
|||||