
Chinese General Practice ›› 2023, Vol. 26 ›› Issue (35): 4425-4432.DOI: 10.12114/j.issn.1007-9572.2023.0260
• Article • Previous Articles Next Articles
Received:2023-03-28
Revised:2023-07-06
Published:2023-12-15
Online:2023-07-27
Contact:
SHI Sen
通讯作者:
施森
作者简介:基金资助:
| 地区 | 性别 | 患病人数 | 粗患病率 | 年龄标化患病率 | ||||||
|---|---|---|---|---|---|---|---|---|---|---|
| 1990年(95%UI)(×10万) | 2019年(95%UI)(×10万) | 变化率(%) | 1990年(95%UI)(1/10万) | 2019年(95%UI)(1/10万) | 变化率(%) | 1990年(95%UI)(1/10万) | 2019年(95%UI)(1/10万) | 变化率(%) | ||
| 中国 | 男性 | 28.22(24.03,32.53) | 71.74(61.29,82.49) | 154.22 | 462.40(393.73,533.09) | 989.79(845.60,1 138.07) | 114.05 | 731.02(631.44,836.51) | 744.96(644.62,850.82) | 1.91 |
| 女性 | 75.78(65.04,86.78) | 213.15(183.34,244.52) | 181.27 | 1 321.44(1 134.16,1 513.18) | 3 055.85(2 628.40,3 505.48) | 131.25 | 1 839.43(1 593.06,2 095.46) | 2 022.13(1 750.00,2 309.13) | 9.93 | |
| 日本 | 女性 | 30.72(26.73,34.70) | 37.26(32.11,42.65) | 21.29 | 4 801.14(4 177.38,5 422.56) | 5 686.97(4 901.04,6 509.51) | 18.45 | 3 182.64(2 782.59,3 587.70) | 1 846.52(1 606.47,2 091.10) | -41.98 |
| 韩国 | 女性 | 3.88(3.34,4.42) | 7.53(6.51,8.61) | 94.07 | 1 756.55(1 512.74,2 001.33) | 2 850.98(2 466.53,3 260.43) | 62.31 | 2 409.29(2 083.25,2 739.95) | 1 519.64(1 314.65,1 737.66) | -36.93 |
| 印度 | 女性 | 21.43(18.33,24.63) | 61.15(52.96,70.11) | 185.35 | 522.29(446.86,600.39) | 902.56(781.69,1 034.75) | 72.81 | 1 135.33(985.40,1 300.95) | 1 105.89(959.02,1 261.32) | -2.59 |
| 全球 | 女性 | 447.95(390.62,507.73) | 760.93(665.87,861.71) | 69.87 | 1 686.50(1 470.66,1 911.55) | 1 973.12(1 726.63,2 234.45) | 16.99 | 2 181.02(1 905.72,2 471.79) | 1 735.06(1 519.05,1 964.04) | -20.45 |
Table 1 Prevalence of PAD among Chinese men and women in China,Japan,Korea,India and globally in 1990 and 2019
| 地区 | 性别 | 患病人数 | 粗患病率 | 年龄标化患病率 | ||||||
|---|---|---|---|---|---|---|---|---|---|---|
| 1990年(95%UI)(×10万) | 2019年(95%UI)(×10万) | 变化率(%) | 1990年(95%UI)(1/10万) | 2019年(95%UI)(1/10万) | 变化率(%) | 1990年(95%UI)(1/10万) | 2019年(95%UI)(1/10万) | 变化率(%) | ||
| 中国 | 男性 | 28.22(24.03,32.53) | 71.74(61.29,82.49) | 154.22 | 462.40(393.73,533.09) | 989.79(845.60,1 138.07) | 114.05 | 731.02(631.44,836.51) | 744.96(644.62,850.82) | 1.91 |
| 女性 | 75.78(65.04,86.78) | 213.15(183.34,244.52) | 181.27 | 1 321.44(1 134.16,1 513.18) | 3 055.85(2 628.40,3 505.48) | 131.25 | 1 839.43(1 593.06,2 095.46) | 2 022.13(1 750.00,2 309.13) | 9.93 | |
| 日本 | 女性 | 30.72(26.73,34.70) | 37.26(32.11,42.65) | 21.29 | 4 801.14(4 177.38,5 422.56) | 5 686.97(4 901.04,6 509.51) | 18.45 | 3 182.64(2 782.59,3 587.70) | 1 846.52(1 606.47,2 091.10) | -41.98 |
| 韩国 | 女性 | 3.88(3.34,4.42) | 7.53(6.51,8.61) | 94.07 | 1 756.55(1 512.74,2 001.33) | 2 850.98(2 466.53,3 260.43) | 62.31 | 2 409.29(2 083.25,2 739.95) | 1 519.64(1 314.65,1 737.66) | -36.93 |
| 印度 | 女性 | 21.43(18.33,24.63) | 61.15(52.96,70.11) | 185.35 | 522.29(446.86,600.39) | 902.56(781.69,1 034.75) | 72.81 | 1 135.33(985.40,1 300.95) | 1 105.89(959.02,1 261.32) | -2.59 |
| 全球 | 女性 | 447.95(390.62,507.73) | 760.93(665.87,861.71) | 69.87 | 1 686.50(1 470.66,1 911.55) | 1 973.12(1 726.63,2 234.45) | 16.99 | 2 181.02(1 905.72,2 471.79) | 1 735.06(1 519.05,1 964.04) | -20.45 |
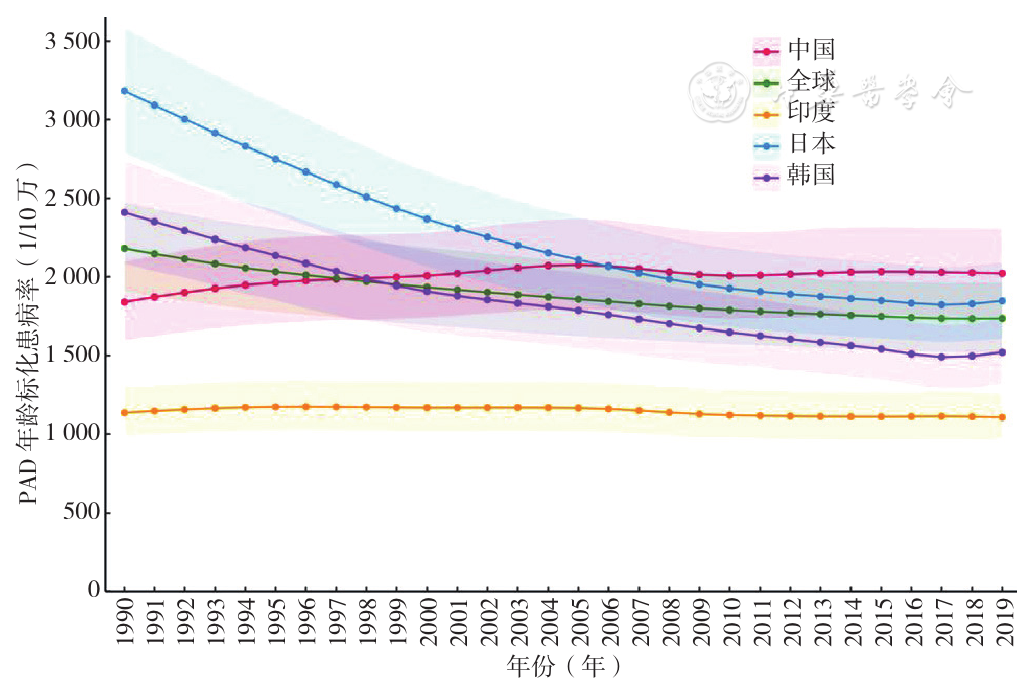
Figure 1 Trends in the age-standardized prevalence of PAD in women from 1990 to 2019 in globally,China,India,Japan,and Korea
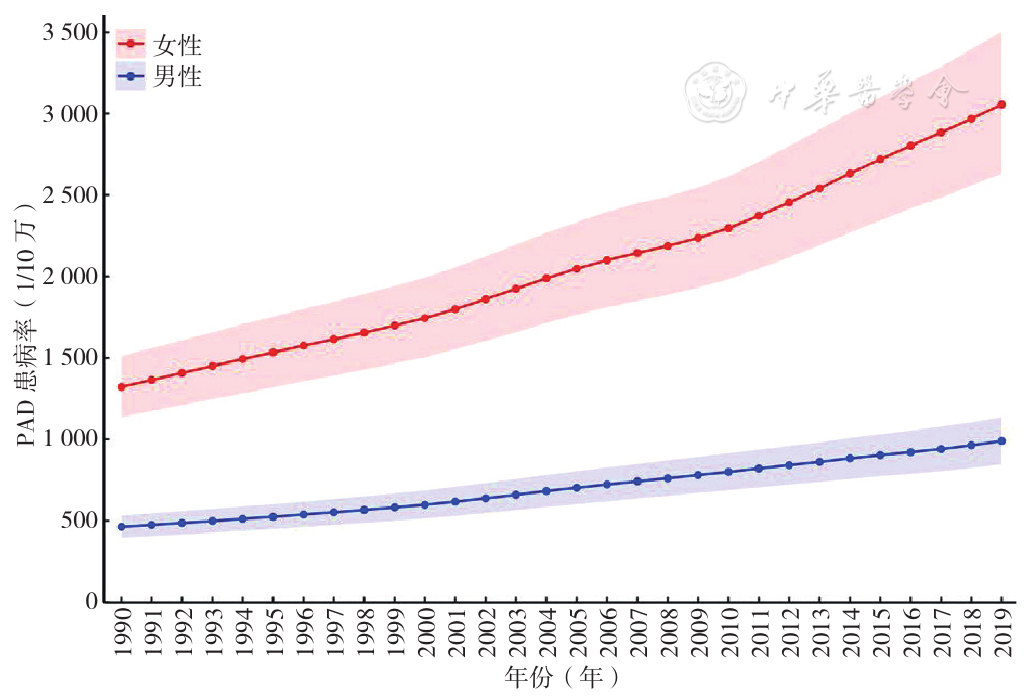
Figure 2 Gender prevalence of PAD in China from 1990 to 2019
| 项目 | 性别 | 趋势1 | 趋势2 | 趋势3 | AAPC(95%CI) | |||
|---|---|---|---|---|---|---|---|---|
| 年份 | APC(95%CI) | 年份 | APC(95%CI) | 年份 | APC(95%CI) | |||
| 粗患病率 | 男性 | 1990—1999年 | 2.58(2.52,2.65)a | 1999—2007年 | 3.17(3.07,3.26)a | 2007—2019年 | 2.39(2.34,2.43)a | 2.66(2.63,2.70)a |
| 女性 | 1990—2006年 | 2.90(2.84,2.96)a | 2006—2009年 | 2.21(0.67,3.77)a | 2009—2019年 | 3.24(3.11,3.36)a | 2.94(2.78,3.10)a | |
| 年龄标化患病率 | 男性 | 1990—1993年 | 0.91(0.68,1.14)a | 1993—2005年 | 0.49(0.46,0.52)a | 2005—2019年 | -0.50(-0.52,-0.48)a | 0.05(0.03,0.08)a |
| 女性 | 1990—2005年 | 0.73(0.65,0.81)a | 2005—2009年 | -0.93(-1.87,0.03) | 2009—2019年 | 0.10(-0.05,0.25) | 0.28(0.14,0.42)a | |
Table 2 Temporal changes of PAD prevalence and age-standardized prevalence in China from 1990 to 2019
| 项目 | 性别 | 趋势1 | 趋势2 | 趋势3 | AAPC(95%CI) | |||
|---|---|---|---|---|---|---|---|---|
| 年份 | APC(95%CI) | 年份 | APC(95%CI) | 年份 | APC(95%CI) | |||
| 粗患病率 | 男性 | 1990—1999年 | 2.58(2.52,2.65)a | 1999—2007年 | 3.17(3.07,3.26)a | 2007—2019年 | 2.39(2.34,2.43)a | 2.66(2.63,2.70)a |
| 女性 | 1990—2006年 | 2.90(2.84,2.96)a | 2006—2009年 | 2.21(0.67,3.77)a | 2009—2019年 | 3.24(3.11,3.36)a | 2.94(2.78,3.10)a | |
| 年龄标化患病率 | 男性 | 1990—1993年 | 0.91(0.68,1.14)a | 1993—2005年 | 0.49(0.46,0.52)a | 2005—2019年 | -0.50(-0.52,-0.48)a | 0.05(0.03,0.08)a |
| 女性 | 1990—2005年 | 0.73(0.65,0.81)a | 2005—2009年 | -0.93(-1.87,0.03) | 2009—2019年 | 0.10(-0.05,0.25) | 0.28(0.14,0.42)a | |
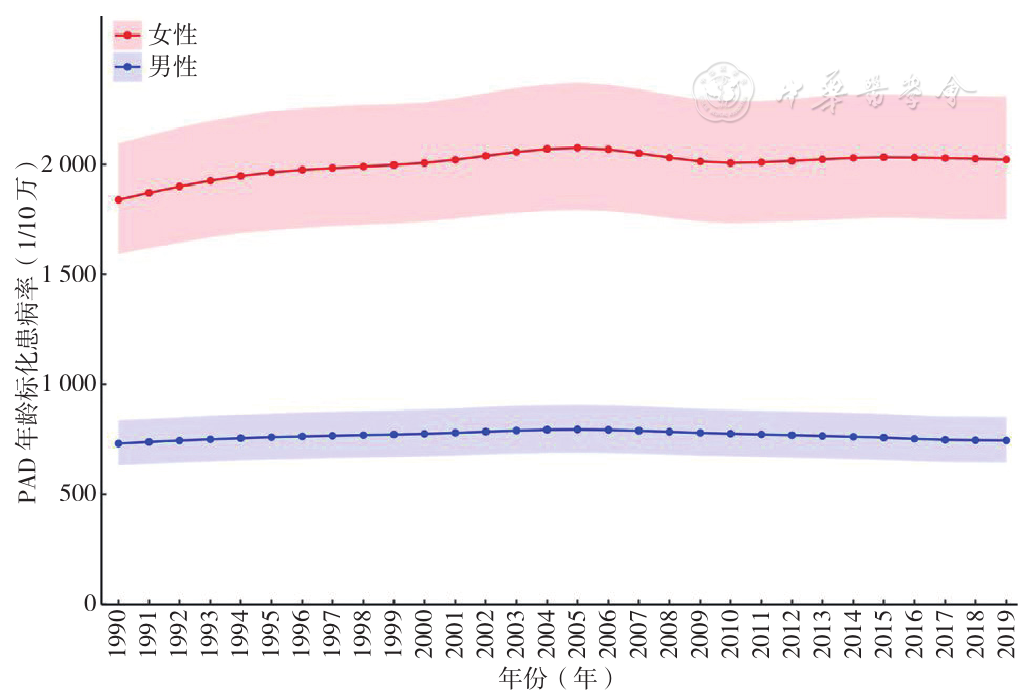
Figure 3 Gender and age standardized prevalence of PAD in China from 1990 to 2019
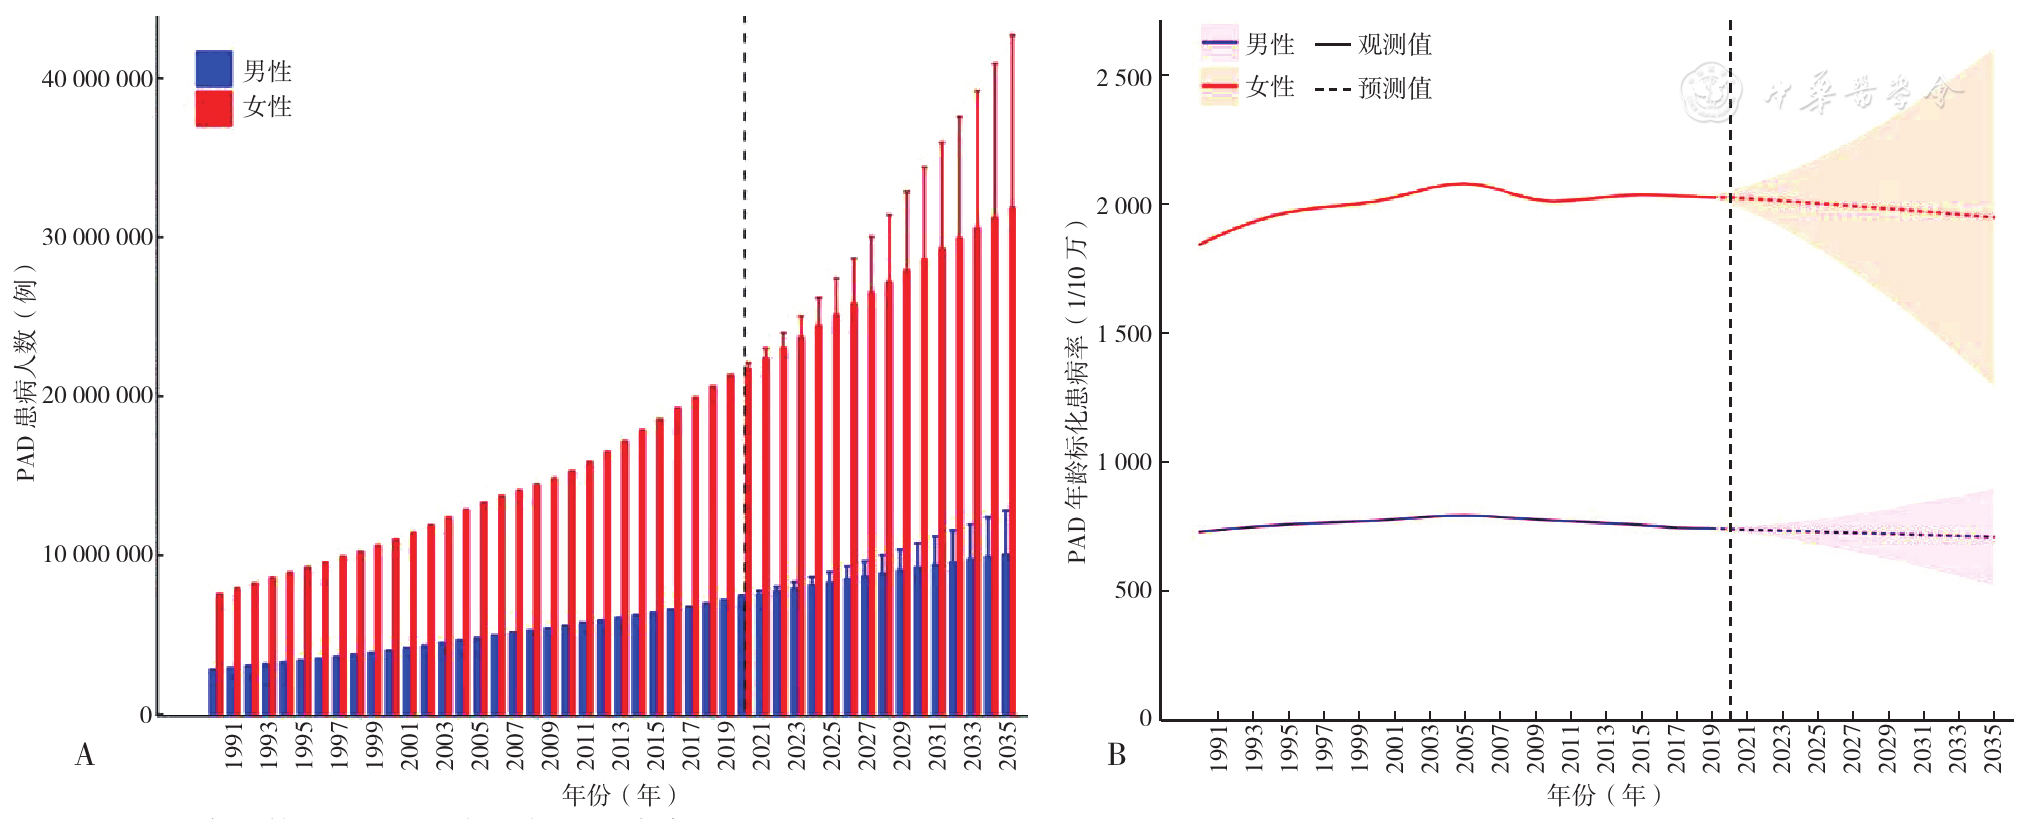
Figure 4 Prediction of the changing trend of the number cases and age-standardized prevalence of PAD by gender in China from 2020 to 2035
| 分层 | 患病人数 | 年龄标化患病率/年龄分层患病率 | ||||
|---|---|---|---|---|---|---|
| 2019年(×10万) | 2035年(×10万) | 变化率(%) | 2019年(1/10万) | 2035年(1/10万) | 变化率(%) | |
| 男性 | 71.74(61.29,82.49) | 101.30(74.17,128.43) | 41.20 | 744.96(644.62,850.82) | 712.09(521.26,902.92) | -4.41 |
| 女性 | 213.15(183.34,244.52) | 319.24(211.74,426.74) | 49.77 | 2 022.13(1 750.00,2 309.13) | 1 945.97(1 290.41,2 601.54) | -3.77 |
| 年龄 | ||||||
| 40~44岁 | 3.53(2.63,4.53) | 3.44(2.03,4.86) | -2.55 | 709.33(528.11,909.28) | 685.46(451.91,997.17) | -3.37 |
| 45~49岁 | 10.28(8.00,13.02) | 10.23(6.48,13.98) | -0.49 | 1 727.05(1 343.83,2 186.38) | 1 669.34(1 141.36,2 356.88) | -3.34 |
| 50~54岁 | 20.45(15.47,26.47) | 16.84(10.99,22.68) | -17.65 | 3 283.85(2 484.01,4 250.95) | 3 176.14(2 211.35,4 416.94) | -3.28 |
| 55~59岁 | 24.22(18.92,29.50) | 23.60(15.55,31.65) | -2.56 | 5 130.90(4 009.67,6 250.79) | 4 954.32(3 467.83,6 858.72) | -3.44 |
| 60~64岁 | 28.05(21.86,34.20) | 37.79(24.90,50.67) | 34.72 | 7 174.76(5 591.51,8 748.45) | 6 911.64(4 838.26,9 567.32) | -3.67 |
| 65~69岁 | 35.15(28.53,42.76) | 54.23(35.74,72.71) | 54.28 | 9 808.05(7 962.41,11 931.32) | 9 534.03(6 674.27,13 197.34) | -2.79 |
| 70~74岁 | 31.48(24.75,38.93) | 55.89(36.84,74.94) | 77.54 | 12 834.99(10 090.64,15 872.26) | 12 644.82(8 851.97,17 502.76) | -1.48 |
| 75~79岁 | 24.68(19.95,29.94) | 47.23(31.13,63.32) | 91.37 | 15 710.38(12 701.39,19 056.28) | 15 578.80(10 906.09,21 564.03) | -0.84 |
| 80~84岁 | 19.50(15.94,23.57) | 42.34(27.91,56.77) | 117.10 | 18 233.42(14 904.87,22 040.04) | 18 047.91(12 634.59,24 981.53) | -1.02 |
| 85~89岁 | 11.03(9.15,13.23) | 22.05(14.54,29.57) | 99.91 | 19 956.90(16 549.96,23 939.22) | 19 644.12(13 752.07,27 191.05) | -1.57 |
| 90~94岁 | 3.90(3.26,4.62) | 8.00(5.28,10.73) | 105.10 | 21 005.15(17 575.78,24 849.58) | 20 503.84(14 353.82,28 381.23) | -2.39 |
| ≥95岁 | 0.89(0.74,1.06) | 2.42(1.59,3.24) | 171.90 | 19 900.02(16 381.60,23 738.57) | 21 118.14(14 783.68,29 231.74) | 6.12 |
Table 3 Comparison of number of cases and age-standardized prevalence of PAD in China in 2019 and 2035
| 分层 | 患病人数 | 年龄标化患病率/年龄分层患病率 | ||||
|---|---|---|---|---|---|---|
| 2019年(×10万) | 2035年(×10万) | 变化率(%) | 2019年(1/10万) | 2035年(1/10万) | 变化率(%) | |
| 男性 | 71.74(61.29,82.49) | 101.30(74.17,128.43) | 41.20 | 744.96(644.62,850.82) | 712.09(521.26,902.92) | -4.41 |
| 女性 | 213.15(183.34,244.52) | 319.24(211.74,426.74) | 49.77 | 2 022.13(1 750.00,2 309.13) | 1 945.97(1 290.41,2 601.54) | -3.77 |
| 年龄 | ||||||
| 40~44岁 | 3.53(2.63,4.53) | 3.44(2.03,4.86) | -2.55 | 709.33(528.11,909.28) | 685.46(451.91,997.17) | -3.37 |
| 45~49岁 | 10.28(8.00,13.02) | 10.23(6.48,13.98) | -0.49 | 1 727.05(1 343.83,2 186.38) | 1 669.34(1 141.36,2 356.88) | -3.34 |
| 50~54岁 | 20.45(15.47,26.47) | 16.84(10.99,22.68) | -17.65 | 3 283.85(2 484.01,4 250.95) | 3 176.14(2 211.35,4 416.94) | -3.28 |
| 55~59岁 | 24.22(18.92,29.50) | 23.60(15.55,31.65) | -2.56 | 5 130.90(4 009.67,6 250.79) | 4 954.32(3 467.83,6 858.72) | -3.44 |
| 60~64岁 | 28.05(21.86,34.20) | 37.79(24.90,50.67) | 34.72 | 7 174.76(5 591.51,8 748.45) | 6 911.64(4 838.26,9 567.32) | -3.67 |
| 65~69岁 | 35.15(28.53,42.76) | 54.23(35.74,72.71) | 54.28 | 9 808.05(7 962.41,11 931.32) | 9 534.03(6 674.27,13 197.34) | -2.79 |
| 70~74岁 | 31.48(24.75,38.93) | 55.89(36.84,74.94) | 77.54 | 12 834.99(10 090.64,15 872.26) | 12 644.82(8 851.97,17 502.76) | -1.48 |
| 75~79岁 | 24.68(19.95,29.94) | 47.23(31.13,63.32) | 91.37 | 15 710.38(12 701.39,19 056.28) | 15 578.80(10 906.09,21 564.03) | -0.84 |
| 80~84岁 | 19.50(15.94,23.57) | 42.34(27.91,56.77) | 117.10 | 18 233.42(14 904.87,22 040.04) | 18 047.91(12 634.59,24 981.53) | -1.02 |
| 85~89岁 | 11.03(9.15,13.23) | 22.05(14.54,29.57) | 99.91 | 19 956.90(16 549.96,23 939.22) | 19 644.12(13 752.07,27 191.05) | -1.57 |
| 90~94岁 | 3.90(3.26,4.62) | 8.00(5.28,10.73) | 105.10 | 21 005.15(17 575.78,24 849.58) | 20 503.84(14 353.82,28 381.23) | -2.39 |
| ≥95岁 | 0.89(0.74,1.06) | 2.42(1.59,3.24) | 171.90 | 19 900.02(16 381.60,23 738.57) | 21 118.14(14 783.68,29 231.74) | 6.12 |
| 危险因素 | 女性 | 男性 |
|---|---|---|
| 高血压 | 32.31 | 18.97 |
| 糖尿病 | 24.81 | 16.11 |
| 肾功能不全 | 17.27 | 10.66 |
| 吸烟 | 14.91 | 44.32 |
| 高盐饮食 | 8.40 | 7.81 |
| 铅暴露 | 2.30 | 2.13 |
Table 4 Proportion of risk factors of PAD disease burden in China in 2019
| 危险因素 | 女性 | 男性 |
|---|---|---|
| 高血压 | 32.31 | 18.97 |
| 糖尿病 | 24.81 | 16.11 |
| 肾功能不全 | 17.27 | 10.66 |
| 吸烟 | 14.91 | 44.32 |
| 高盐饮食 | 8.40 | 7.81 |
| 铅暴露 | 2.30 | 2.13 |
| [1] |
|
| [2] |
|
| [3] |
|
| [4] |
|
| [5] |
|
| [6] |
|
| [7] |
|
| [8] |
|
| [9] |
|
| [10] |
|
| [11] |
|
| [12] |
|
| [13] |
|
| [14] |
|
| [15] |
|
| [16] |
李辉章,杜灵彬. Joinpoint回归模型在肿瘤流行病学时间趋势分析中的应用[J]. 中华预防医学杂志,2020,54(8):908-912. DOI:10.3760/cma.j.cn112150-20200616-00889.
|
| [17] |
王红心,樊文龙,杨晓雨,等. 1990—2019年中国蛋白质能量营养不良发病趋势及预测研究[J]. 中国全科医学,2023,26(5):591-597. DOI:10.12114/j.issn.1007-9572.2022.0556.
|
| [18] |
许晴晴,严永富,陈浩,等. 中国四大慢性病死亡率可持续发展目标实现的预测研究[J]. 中华流行病学杂志,2022,43(6):878-884. DOI:10.3760/cma.j.cn112338-20211028-00830.
|
| [19] |
梁珊珊,周智华,李成程,等. 1990—2019年中国糖尿病疾病负担及发病预测分析[J]. 中国全科医学,2023,26(16):2013-2019. DOI:10.12114/j.issn.1007-9572.2023.0009.
|
| [20] |
|
| [21] |
|
| [22] |
|
| [23] |
|
| [24] |
|
| [25] |
|
| [26] |
|
| [27] |
|
| [28] |
项鑫,王乙. 中国人口老龄化现状、特点、原因及对策[J]. 中国老年学杂志,2021,41(18):4149-4152. DOI:10.3969/j.issn.1005-9202.2021.18.072.
|
| [29] |
|
| [30] |
|
| [31] |
|
| [32] |
|
| [33] |
|
| [34] |
|
| [35] |
|
| [36] |
|
| [37] |
|
| [38] |
|
| [39] |
|
| [40] |
|
| [41] |
赵倩南,王淳秀,关绍晨,等. 北京地区35岁及以上人群外周动脉疾病患病率特点及影响因素分析[J]. 中华心血管病杂志,2019,47(12):1000-1004. DOI:10.3760/cma.j.issn.0253?3758.2019.12.010.
|
| [42] |
蔡毅,崔华,范利. 北京市军队老年男性高血压患者心脑血管疾病患病率调查[J]. 中国康复理论与实践,2015,21(11):1298-1303. DOI:10.3969/j.issn.1006-9771.2015.11.014.
|
| [43] |
李宪凯,韩扬,徐大春,等. 踝臂指数与外周动脉疾病死亡率之间的关系[J]. 同济大学学报(医学版),2015,36(2):74-80. DOI:10.16118/j.1008-0392.2015.02.017.
|
| [44] |
|
| [45] |
|
| [46] |
|
| [47] |
|
| [48] |
|
| [49] |
|
| [50] |
|
| [1] | LIU Ailing, ZHOU Jingjing, LI Chengcheng, HE Kaiyue, LIANG Shanshan, ZHOU Shangcheng. Analysis of the Disease Burden Trends and Death Projections for Esophageal Cancer Attributable to Tobacco in China from 1990 to 2019 [J]. Chinese General Practice, 2023, 26(36): 4587-4594. |
| [2] | WANG Lina, GAO Pengfei, CAO Fan, GE Ying, YAN Wei, HE Daikun. Analysis of the Prevalence and Influencing Factors of Non-alcoholic Fatty Liver Disease in Different Gender Groups [J]. Chinese General Practice, 2023, 26(33): 4143-4151. |
| [3] | JIAN Qiufeng, XU Ronghua, YAO Qian, ZHOU Yuanyuan. A Meta-analysis of the Prevalence and Influencing Factors of Post-stroke Cognitive Impairment in Chinese Elderly Patients [J]. Chinese General Practice, 2023, 26(32): 4070-4079. |
| [4] | MA Liyuan, WANG Zengwu, FAN Jing, HU Shengshou. Interpretation of Report on Cardiovascular Health and Diseases in China 2022 [J]. Chinese General Practice, 2023, 26(32): 3975-3994. |
| [5] | HE Li, ZHANG Yifan, SHEN Xuechun, SUN Yan, ZHAO Yang. Prevalence Trends of Multimorbidity among Residents in Mainland China: a Meta-analysis [J]. Chinese General Practice, 2023, 26(29): 3599-3607. |
| [6] | TIAN Meiling, MA Guojuan, DU Liyan, XIAO Yuange, ZHANG Sai, ZHANG Cui, TANG Zengjun. Prevalence and Epidemiology of Gestational Diabetes Mellitus from 2014 to 2021 in Hebei Province [J]. Chinese General Practice, 2023, 26(26): 3320-3324. |
| [7] | YANG Lu, ZONG Zhanhong, YI Yingying. Current Status and Influencing Factors of Depression among Rural Middle-aged and Elderly Women in China [J]. Chinese General Practice, 2023, 26(25): 3091-3095. |
| [8] | LIN Yang, WANG Fang, WANG Han, WU Rong, WANG Yao, XU Ziyao, WANG Xu, WANG Yanding. Prevalence of Frailty in Elderly Patients with Comorbidity: a Meta-analysis [J]. Chinese General Practice, 2023, 26(25): 3185-3193. |
| [9] | SUN Xuhai, SHI Xiuxiu, ZHAO Zhengzheng, HAN Jinxiang. Characteristics of Newly Increased and Deceased Patients with Severe Mental Illness in a Community in Beijing from 2011 to 2021 [J]. Chinese General Practice, 2023, 26(19): 2402-2407. |
| [10] | GE Anxin, ZHANG Guiqing, JIANG Liang, XING Wenlong, HU Min, LI Haohao, MENG Yao. Epidemiological Survey of the Prevalence and Associated Factors of Mental Disorders in Xinjiang Uygur Autonomous Region [J]. Chinese General Practice, 2023, 26(19): 2395-2401. |
| [11] | LIANG Shanshan, ZHOU Zhihua, LI Chengcheng, CHEN Huijing, ZHOU Shangcheng. Diabetes in China: Burden Analysis between 1990 and 2019 and Incidence Prediction between 2020 and 2030 [J]. Chinese General Practice, 2023, 26(16): 2013-2019. |
| [12] | HE Jiahui, LI Peiwen, MA Ximin, QIAO Hui. Influencing Factors of Non-treatment-seeking Behaviors for Perceived Morbidity within Two Weeks among Rural Residents in Western China [J]. Chinese General Practice, 2023, 26(16): 1946-1952. |
| [13] | LIU Yaxin, JIANG Yunlan, HUANG Xiaoxing, PAN Jing, SHEN Yinli, ZHANG Yue. The Prevalence of Dysphagia among Chinese Older Adults: a Meta-analysis [J]. Chinese General Practice, 2023, 26(12): 1496-1502. |
| [14] | DUAN Zhaohui, ZHANG Min, XU Jieru, XIONG Wenjing, CHEN Lei, ZHAO Xiangling, ZHANG Yiyun, RANG Weiqing. Past (2000-2019) and Future (2020-2024) Trends of Brain Cancer Mortality in China [J]. Chinese General Practice, 2023, 26(06): 734-741. |
| [15] | WANG Hongxin, FAN Wenlong, YANG Xiaoyu, CHEN Dongyu, HUANG Qiao, PAN Suyue, WANG Pu, HU Min, HE Yuqing. Protein-energy Malnutrition Incidence in China: Trend in 1990-2019 and Future Trend in 2020-2029 [J]. Chinese General Practice, 2023, 26(05): 591-597. |
| Viewed | ||||||
|
Full text |
|
|||||
|
Abstract |
|
|||||