
中国全科医学 ›› 2025, Vol. 28 ›› Issue (02): 183-192.DOI: 10.12114/j.issn.1007-9572.2024.0177
刘庆平, 柯居中, 宋家慧, 高娇娇, 李智韬, 王小楠, 邱桦, 周弋, 阮晓楠, 吴抗*( )
)
收稿日期:2024-06-10
修回日期:2024-08-20
出版日期:2025-01-15
发布日期:2024-10-28
通讯作者:
吴抗
作者贡献:
刘庆平提出研究理念,负责数据整理,统计分析,论文撰写;柯居中、宋家慧负责数据整理,提供统计学设计思路,协助论文修改;高娇娇、李智韬、王小楠负责数据整理;邱桦负责数据整理,统计学设计,分析可行性;周弋、阮晓楠负责思路指导;吴抗负责编辑与修改论文,对文章监督管理和审查。
基金资助:
LIU Qingping, KE Juzhong, SONG Jiahui, GAO Jiaojiao, LI Zhitao, WANG Xiaonan, QIU Hua, ZHOU Yi, RUAN Xiaonan, WU Kang*()
Received:2024-06-10
Revised:2024-08-20
Published:2025-01-15
Online:2024-10-28
Contact:
WU Kang
摘要: 背景 糖尿病仍是全球重大公共卫生问题,横断面研究发现内脏脂肪与糖尿病患病密切相关,但糖尿病发病时间趋势及其与中国内脏脂肪指数(CVAI)关系的前瞻性队列研究较少。 目的 通过前瞻性队列研究分析上海市浦东新区居民糖尿病发病时间趋势及其与CVAI的关系,为其科学防治提供依据。 方法 本研究为前瞻性队列研究。选取2013年1—7月参与浦东新区慢性病危险因素监测项目的12个乡镇街道的35个村、居委的居民5 236人为研究队列。收集其基线资料,内容包括CVAI、内脏脂肪指数(VAI)、BMI、腰围(WC)、腰臀比(WHR)、腰高比(WHtR)、身体形态指数(ABSI)和身体肥胖指数(BAI),分别于2016年和2019年进行追踪随访;截至随访结束(2019年10月),通过问卷调查、实验室检查、医疗系统就诊信息和生命统计信息系统判断该研究队列糖尿病新发情况。依据基线CVAI、VAI、BMI、WC、WHR、WHtR、ABSI、BAI四分位数将纳入人群分别分为第Q1~Q4四分位数:CVAI各组人数依次为1 306、1 307、1 307、1 307人;VAI各组人数依次为1 300、1 316、1 306、1 306例;BMI各组人数依次为1 305、1 302、1 312、1 311人;WC各组人数依次为1 302、1 273、1 287、1 367人;WHR各组人数依次为1 180、1 203、1 332、1 514人;WHtR各组人数依次为1 199、1 393、1 400、1 237人;ABSI各组人数依次为1 316、1 302、1 302、1 308人;BAI各组人数依次为1 310、1 304、1 308、1 307人。采用多因素Cox回归分析CVAI和其他肥胖指标与糖尿病发病的关系;采用受试者工作特征曲线(ROC曲线)比较CVAI与其他肥胖指标的预测作用。 结果 浦东新区居民2013—2016年糖尿病发病密度为33.55/1 000人年,2017—2019年糖尿病发病密度为23.25/1 000人年,随着年龄的增长,糖尿病总发病密度呈现出升高趋势(2013—2016年:χ2=28.503,P趋势<0.001;2017—2019年:χ2=25.600,P趋势<0.001)。截至2016年,基线CVAI四分位数越高,糖尿病累积发病率(CVAI:χ2=131.865,P趋势<0.001)和发病密度(CVAI:χ2=100.105,P趋势<0.001)均越高。调整相关混杂因素后的多因素Cox回归分析结果显示,与CVAI处于Q1相比,CVAI处于Q4的男性糖尿病的发病风险增加79.4%(HR=1.794,95%CI=1.044~3.083,P<0.05),女性糖尿病的发病风险增加371.2%(HR=4.712,95%CI=2.601~8.538,P<0.05)。ROC曲线结果显示,在预测男性糖尿病发病情况中,CVAI对男性糖尿病预测的ROC曲线下面积(AUC)为0.600(95%CI=0.561~0.640),识别男性糖尿病的约登指数为0.181,截断值为104.118;Delong检验结果显示,CVAI对女性糖尿病预测的准确性最高(AUC=0.699),且在识别女性糖尿病时有最大的约登指数值0.317,最佳截断值为104.609。 结论 2013—2019年上海市浦东新区居民糖尿病发病密度随年龄的增长呈升高趋势;且相较于其他肥胖指标,CVAI可作为预测糖尿病发病风险的指标。
中图分类号:
| 年龄组(岁) | 男 | 女 | 合计 | ||||||
|---|---|---|---|---|---|---|---|---|---|
| 人数 | 观察人年数 | 发病密度(/1 000人年) | 人数 | 观察人年数 | 发病密度(/1 000人年) | 人数 | 观察人年数 | 发病密度(/1 000人年) | |
| 15~ | 0 | 91.42 | 0.00 | 1 | 77.75 | 12.86 | 1 | 169.17 | 5.91 |
| 25~ | 3 | 166.58 | 18.01 | 2 | 279.58 | 7.15 | 5 | 446.17 | 11.21 |
| 35~ | 9 | 315.08 | 28.56 | 13 | 829.08 | 15.68 | 22 | 1 144.17 | 19.23 |
| 45~ | 21 | 819.50 | 25.63 | 67 | 2 330.58 | 28.75 | 88 | 3 150.08 | 27.94 |
| 55~ | 91 | 2 288.83 | 39.76 | 138 | 4 439.33 | 31.09 | 229 | 6 728.17 | 34.04 |
| 65~ | 66 | 1 241.75 | 53.15 | 64 | 1 623.00 | 39.43 | 130 | 2 864.75 | 45.38 |
| 75~ | 24 | 578.67 | 41.47 | 28 | 626.25 | 44.71 | 52 | 1 204.92 | 43.16 |
| 合计 | 214 | 5 501.83 | 38.90 | 313 | 10 205.58 | 30.67 | 527 | 15 707.42 | 33.55 |
| 中标率 | 23.92 | 20.44 | 21.09 | ||||||
| 世标率 | 22.37 | 19.69 | 20.01 | ||||||
| χ2趋势值 | 12.255 | 15.254 | 28.503 | ||||||
| P趋势值 | 0.057 | 0.018 | <0.001 | ||||||
表1 2013—2016年浦东新区居民糖尿病发病密度
Table 1 Incidence density of diabetes mellitus among residents in Pudong New Area from 2013 to 2016
| 年龄组(岁) | 男 | 女 | 合计 | ||||||
|---|---|---|---|---|---|---|---|---|---|
| 人数 | 观察人年数 | 发病密度(/1 000人年) | 人数 | 观察人年数 | 发病密度(/1 000人年) | 人数 | 观察人年数 | 发病密度(/1 000人年) | |
| 15~ | 0 | 91.42 | 0.00 | 1 | 77.75 | 12.86 | 1 | 169.17 | 5.91 |
| 25~ | 3 | 166.58 | 18.01 | 2 | 279.58 | 7.15 | 5 | 446.17 | 11.21 |
| 35~ | 9 | 315.08 | 28.56 | 13 | 829.08 | 15.68 | 22 | 1 144.17 | 19.23 |
| 45~ | 21 | 819.50 | 25.63 | 67 | 2 330.58 | 28.75 | 88 | 3 150.08 | 27.94 |
| 55~ | 91 | 2 288.83 | 39.76 | 138 | 4 439.33 | 31.09 | 229 | 6 728.17 | 34.04 |
| 65~ | 66 | 1 241.75 | 53.15 | 64 | 1 623.00 | 39.43 | 130 | 2 864.75 | 45.38 |
| 75~ | 24 | 578.67 | 41.47 | 28 | 626.25 | 44.71 | 52 | 1 204.92 | 43.16 |
| 合计 | 214 | 5 501.83 | 38.90 | 313 | 10 205.58 | 30.67 | 527 | 15 707.42 | 33.55 |
| 中标率 | 23.92 | 20.44 | 21.09 | ||||||
| 世标率 | 22.37 | 19.69 | 20.01 | ||||||
| χ2趋势值 | 12.255 | 15.254 | 28.503 | ||||||
| P趋势值 | 0.057 | 0.018 | <0.001 | ||||||
| 年龄组(岁) | 男 | 女 | 合计 | ||||||
|---|---|---|---|---|---|---|---|---|---|
| 人数 | 观察人年数 | 发病密度(/1 000人年) | 人数 | 观察人年数 | 发病密度(/1 000人年) | 人数 | 观察人年数 | 发病密度(/1 000人年) | |
| 15~ | 0 | 29.60 | 0.00 | 0 | 45.93 | 0.00 | 0 | 75.52 | 0.00 |
| 25~ | 1 | 263.08 | 3.80 | 2 | 279.89 | 7.15 | 3 | 542.97 | 5.53 |
| 35~ | 4 | 309.00 | 12.95 | 10 | 684.83 | 14.60 | 14 | 993.82 | 14.09 |
| 45~ | 11 | 687.50 | 16.00 | 31 | 1 818.43 | 17.05 | 42 | 2 505.93 | 16.76 |
| 55~ | 46 | 1 735.78 | 26.50 | 91 | 4 010.54 | 22.69 | 137 | 5 746.32 | 23.84 |
| 65~ | 47 | 1 721.68 | 27.30 | 72 | 2 194.76 | 32.81 | 119 | 3 916.44 | 30.38 |
| 75~ | 10 | 566.12 | 17.66 | 25 | 709.43 | 35.24 | 35 | 1 275.56 | 27.44 |
| 合计 | 119 | 5 312.77 | 22.40 | 231 | 9 743.80 | 23.71 | 350 | 15 056.57 | 23.25 |
| 中标率 | 12.03 | 13.75 | 12.97 | ||||||
| 世标率 | 11.14 | 12.74 | 12.00 | ||||||
| χ2趋势值 | 10.112 | 21.216 | 25.600 | ||||||
| P趋势值 | 0.120 | 0.002 | <0.001 | ||||||
表2 2017—2019年浦东新区居民糖尿病发病密度
Table 2 Incidence density of diabetes mellitus among residents in Pudong New Area from 2017 to 2019
| 年龄组(岁) | 男 | 女 | 合计 | ||||||
|---|---|---|---|---|---|---|---|---|---|
| 人数 | 观察人年数 | 发病密度(/1 000人年) | 人数 | 观察人年数 | 发病密度(/1 000人年) | 人数 | 观察人年数 | 发病密度(/1 000人年) | |
| 15~ | 0 | 29.60 | 0.00 | 0 | 45.93 | 0.00 | 0 | 75.52 | 0.00 |
| 25~ | 1 | 263.08 | 3.80 | 2 | 279.89 | 7.15 | 3 | 542.97 | 5.53 |
| 35~ | 4 | 309.00 | 12.95 | 10 | 684.83 | 14.60 | 14 | 993.82 | 14.09 |
| 45~ | 11 | 687.50 | 16.00 | 31 | 1 818.43 | 17.05 | 42 | 2 505.93 | 16.76 |
| 55~ | 46 | 1 735.78 | 26.50 | 91 | 4 010.54 | 22.69 | 137 | 5 746.32 | 23.84 |
| 65~ | 47 | 1 721.68 | 27.30 | 72 | 2 194.76 | 32.81 | 119 | 3 916.44 | 30.38 |
| 75~ | 10 | 566.12 | 17.66 | 25 | 709.43 | 35.24 | 35 | 1 275.56 | 27.44 |
| 合计 | 119 | 5 312.77 | 22.40 | 231 | 9 743.80 | 23.71 | 350 | 15 056.57 | 23.25 |
| 中标率 | 12.03 | 13.75 | 12.97 | ||||||
| 世标率 | 11.14 | 12.74 | 12.00 | ||||||
| χ2趋势值 | 10.112 | 21.216 | 25.600 | ||||||
| P趋势值 | 0.120 | 0.002 | <0.001 | ||||||
| 基线特征 | Q1(n=1 306) | Q2(n=1 307) | Q3(n=1 307) | Q4(n=1 307) | χ2(H)值 | P值 |
|---|---|---|---|---|---|---|
| 性别[例(%)] | ||||||
| 男 | 420(32.16) | 428(32.75) | 472(36.11)a | 518(39.63)ab | 20.486 | <0.001 |
| 女 | 886(67.84) | 879(67.25) | 835(63.89)a | 789(60.37)ab | ||
| 年龄[例(%)] | ||||||
| <45岁 | 378(28.94) | 103(7.88)a | 60(4.59)ab | 41(3.14)ab | 1 008.807 | <0.001 |
| 45~60岁 | 635(48.62) | 676(51.72) | 508(38.87)ab | 332(25.4)abc | ||
| >60岁 | 293(22.43) | 528(40.4)a | 739(56.54)ab | 934(71.46)abc | ||
| 文化程度[例(%)] | ||||||
| 小学以下 | 43(3.29) | 87(6.66)a | 120(9.18)ab | 217(16.6)abc | 301.732 | <0.001 |
| 小学 | 101(7.73) | 112(8.57) | 182(13.93)ab | 206(15.76)ab | ||
| 初中 | 591(45.25) | 667(51.03)a | 603(46.14)b | 566(43.31)b | ||
| 高中 | 387(29.63) | 352(26.93) | 299(22.88)ab | 235(17.98)abc | ||
| 大专及以上 | 184(14.09) | 89(6.81)a | 103(7.88) | 83(6.35)a | ||
| 婚姻状况[例(%)] | ||||||
| 在婚 | 1 172(89.74) | 1 196(91.51) | 1 180(90.28) | 1 122(85.85)abc | 136.881 | <0.001 |
| 离婚/丧偶 | 65(4.98) | 86(6.58) | 109(8.34)a | 176(13.47)abc | ||
| 未婚 | 69(5.28) | 25(1.91)a | 18(1.38)a | 9(0.69)ab | ||
| 吸烟[例(%)] | ||||||
| 否 | 1 043(79.86) | 1 038(79.42) | 1 014(77.58) | 972(74.37)ab | 14.146 | 0.003 |
| 是 | 263(20.14) | 269(20.58) | 293(22.42) | 335(25.63)ab | ||
| 静坐生活方式[例(%)] | ||||||
| 否 | 232(17.81) | 266(20.43) | 271(20.75) | 271(20.75) | 4.992 | 0.172 |
| 是 | 1 071(82.19) | 1 036(79.57) | 1 035(79.25) | 1 035(79.25) | ||
| 参加体育活动[例(%)] | ||||||
| 否 | 974(74.58) | 931(71.23) | 918(70.24)a | 986(75.44)bc | 12.653 | 0.005 |
| 是 | 332(25.42) | 376(28.77) | 389(29.76)a | 321(24.56)bc | ||
| 高血压[例(%)] | ||||||
| 否 | 1 088(83.37) | 864(66.16)a | 687(52.56)ab | 509(38.94)abc | 590.302 | <0.001 |
| 是 | 217(16.63) | 442(33.84)a | 620(47.44)ab | 798(61.06)abc | ||
| 血脂异常[例(%)] | ||||||
| 否 | 1 002(76.72) | 765(58.53)a | 624(47.74)ab | 448(34.28)abc | 507.873 | <0.001 |
| 是 | 304(23.28) | 542(41.47)a | 683(52.26)ab | 859(65.72)abc | ||
| 糖尿病家族史[例(%)] | ||||||
| 否 | 1 161(88.9) | 1 140(87.22) | 1 164(89.06) | 1 193(91.28)ab | 11.195 | 0.011 |
| 是 | 145(11.1) | 167(12.78) | 143(10.94) | 114(8.72)ab | ||
| 高尿酸血症[例(%)] | ||||||
| 否 | 1 245(95.33) | 1 179(90.21)a | 1 095(83.78)ab | 933(71.38)abc | 331.665 | <0.001 |
| 是 | 61(4.67) | 128(9.79)a | 212(16.22)ab | 374(28.62)abc | ||
| BMI分级[例(%)] | ||||||
| 正常 | 1 127(86.29) | 682(52.18)a | 291(22.26)ab | 78(5.97)abc | 2 838.663 | <0.001 |
| 超重 | 171(13.09) | 585(44.76)a | 870(66.56)ab | 599(45.83)abc | ||
| 肥胖 | 8(0.61) | 40(3.06)a | 146(11.17)ab | 630(48.2)abc | ||
| 年龄[M(P25,P75),岁] | 52(44,59) | 58(53,63)a | 61(56,66)ab | 64(59,71)abc | 1 021.686d | <0.001 |
| WC[M(P25,P75),cm] | 73.1(69.0,77.0) | 80.0(75.8,83.0)a | 85.0(80.5,88.0)ab | 92.0(87.5,96.0)abc | 3 148.852d | <0.001 |
| HC[M(P25,P75),cm] | 89.8(86.0,92.8) | 93.5(90.5,96.1)a | 96.0(93.0,99.5)ab | 101.0(97.2,105.0)abc | 2 163.269d | <0.001 |
| WHR[M(P25,P75)] | 0.8(0.8,0.9) | 0.9(0.8,0.9)a | 0.9(0.8,0.9)ab | 0.9(0.9,1.0)abc | 1 657.277d | <0.001 |
| BMI[M(P25,P75),kg/m2] | 21.6(20.4,23) | 23.8(22.5,25.2)a | 25.3(24.1,26.8)ab | 27.8(26.1,29.8)abc | 2 693.996d | <0.001 |
| SBP[M(P25,P75),mmHg] | 125(114.5,139) | 137(124,150)a | 141(130,154.8)ab | 148(136,164)abc | 815.883d | <0.001 |
| DBP[M(P25,P75),mmHg] | 80(73,88) | 85(78,92)a | 87(80,94)ab | 90(83,98)abc | 509.637d | <0.001 |
| TG[M(P25,P75),mmol/L] | 0.9(0.7,1.2) | 1.2(0.9,1.6)a | 1.5(1.1,2.1)ab | 1.9(1.4,2.8)abc | 1 475.264d | <0.001 |
| TC[M(P25,P75),mmol/L] | 5.2(4.5,5.9) | 5.5(4.9,6.2)a | 5.6(4.9,6.3)a | 5.7(4.9,6.4)ab | 135.811d | <0.001 |
| HDL-C[M(P25,P75),mmol/L] | 1.5(1.3,1.8) | 1.4(1.2,1.6)a | 1.3(1.1,1.5)ab | 1.2(1.0,1.4)abc | 804.488d | <0.001 |
| LDL-C[M(P25,P75),mmol/L] | 2.6(2.1,3.2) | 3.1(2.5,3.7)a | 3.2(2.6,3.8)ab | 3.3(2.7,4.0)c | 323.765d | <0.001 |
| CRP[M(P25,P75),mg/L] | 0.1(0,0.2) | 0.2(0.1,0.6)a | 0.3(0.1,0.9)ab | 0.5(0.2,1.7)abc | 676.973d | <0.001 |
| ACR[M(P25,P75),mg/g] | 3.0(0.5,8.0) | 4.0(1.0,10.0) | 4.0(1.0,10.0)a | 6.0(1.0,15.0)abc | 54.319d | <0.001 |
| SUA[M(P25,P75),mmol/L] | 0.3(0.2,0.3) | 0.3(0.3,0.4)a | 0.3(0.3,0.4)ab | 0.4(0.3,0.4)abc | 632.705d | <0.001 |
| SCr[M(P25,P75),μmol/L] | 60(51,69) | 61(53,73)a | 63(55,74)ab | 65(56,76)abc | 123.407d | <0.001 |
| FPG[M(P25,P75),mmol/L] | 5.3(4.9,5.6) | 5.4(5.1,5.7)a | 5.4(5.1,5.8)ab | 5.5(5.2,6.0)abc | 265.249d | <0.001 |
| PBG 2 h[M(P25,P75),mmol/L] | 5.4(4.6,6.4) | 5.9(5.0,6.8)a | 6.2(5.3,7.3)ab | 6.8(5.7,8.1)abc | 464.850d | <0.001 |
| HbA1c[M(P25,P75),%] | 5.2(4.7,5.6) | 5.3(4.8,5.7)a | 5.3(4.9,5.8)ab | 5.4(5.0,5.8)abc | 106.361d | <0.001 |
表3 不同CVAI四分位数的研究人群基线特征比较
Table 3 Comparison of baseline characteristics of the study population with different quartiles of CVAI
| 基线特征 | Q1(n=1 306) | Q2(n=1 307) | Q3(n=1 307) | Q4(n=1 307) | χ2(H)值 | P值 |
|---|---|---|---|---|---|---|
| 性别[例(%)] | ||||||
| 男 | 420(32.16) | 428(32.75) | 472(36.11)a | 518(39.63)ab | 20.486 | <0.001 |
| 女 | 886(67.84) | 879(67.25) | 835(63.89)a | 789(60.37)ab | ||
| 年龄[例(%)] | ||||||
| <45岁 | 378(28.94) | 103(7.88)a | 60(4.59)ab | 41(3.14)ab | 1 008.807 | <0.001 |
| 45~60岁 | 635(48.62) | 676(51.72) | 508(38.87)ab | 332(25.4)abc | ||
| >60岁 | 293(22.43) | 528(40.4)a | 739(56.54)ab | 934(71.46)abc | ||
| 文化程度[例(%)] | ||||||
| 小学以下 | 43(3.29) | 87(6.66)a | 120(9.18)ab | 217(16.6)abc | 301.732 | <0.001 |
| 小学 | 101(7.73) | 112(8.57) | 182(13.93)ab | 206(15.76)ab | ||
| 初中 | 591(45.25) | 667(51.03)a | 603(46.14)b | 566(43.31)b | ||
| 高中 | 387(29.63) | 352(26.93) | 299(22.88)ab | 235(17.98)abc | ||
| 大专及以上 | 184(14.09) | 89(6.81)a | 103(7.88) | 83(6.35)a | ||
| 婚姻状况[例(%)] | ||||||
| 在婚 | 1 172(89.74) | 1 196(91.51) | 1 180(90.28) | 1 122(85.85)abc | 136.881 | <0.001 |
| 离婚/丧偶 | 65(4.98) | 86(6.58) | 109(8.34)a | 176(13.47)abc | ||
| 未婚 | 69(5.28) | 25(1.91)a | 18(1.38)a | 9(0.69)ab | ||
| 吸烟[例(%)] | ||||||
| 否 | 1 043(79.86) | 1 038(79.42) | 1 014(77.58) | 972(74.37)ab | 14.146 | 0.003 |
| 是 | 263(20.14) | 269(20.58) | 293(22.42) | 335(25.63)ab | ||
| 静坐生活方式[例(%)] | ||||||
| 否 | 232(17.81) | 266(20.43) | 271(20.75) | 271(20.75) | 4.992 | 0.172 |
| 是 | 1 071(82.19) | 1 036(79.57) | 1 035(79.25) | 1 035(79.25) | ||
| 参加体育活动[例(%)] | ||||||
| 否 | 974(74.58) | 931(71.23) | 918(70.24)a | 986(75.44)bc | 12.653 | 0.005 |
| 是 | 332(25.42) | 376(28.77) | 389(29.76)a | 321(24.56)bc | ||
| 高血压[例(%)] | ||||||
| 否 | 1 088(83.37) | 864(66.16)a | 687(52.56)ab | 509(38.94)abc | 590.302 | <0.001 |
| 是 | 217(16.63) | 442(33.84)a | 620(47.44)ab | 798(61.06)abc | ||
| 血脂异常[例(%)] | ||||||
| 否 | 1 002(76.72) | 765(58.53)a | 624(47.74)ab | 448(34.28)abc | 507.873 | <0.001 |
| 是 | 304(23.28) | 542(41.47)a | 683(52.26)ab | 859(65.72)abc | ||
| 糖尿病家族史[例(%)] | ||||||
| 否 | 1 161(88.9) | 1 140(87.22) | 1 164(89.06) | 1 193(91.28)ab | 11.195 | 0.011 |
| 是 | 145(11.1) | 167(12.78) | 143(10.94) | 114(8.72)ab | ||
| 高尿酸血症[例(%)] | ||||||
| 否 | 1 245(95.33) | 1 179(90.21)a | 1 095(83.78)ab | 933(71.38)abc | 331.665 | <0.001 |
| 是 | 61(4.67) | 128(9.79)a | 212(16.22)ab | 374(28.62)abc | ||
| BMI分级[例(%)] | ||||||
| 正常 | 1 127(86.29) | 682(52.18)a | 291(22.26)ab | 78(5.97)abc | 2 838.663 | <0.001 |
| 超重 | 171(13.09) | 585(44.76)a | 870(66.56)ab | 599(45.83)abc | ||
| 肥胖 | 8(0.61) | 40(3.06)a | 146(11.17)ab | 630(48.2)abc | ||
| 年龄[M(P25,P75),岁] | 52(44,59) | 58(53,63)a | 61(56,66)ab | 64(59,71)abc | 1 021.686d | <0.001 |
| WC[M(P25,P75),cm] | 73.1(69.0,77.0) | 80.0(75.8,83.0)a | 85.0(80.5,88.0)ab | 92.0(87.5,96.0)abc | 3 148.852d | <0.001 |
| HC[M(P25,P75),cm] | 89.8(86.0,92.8) | 93.5(90.5,96.1)a | 96.0(93.0,99.5)ab | 101.0(97.2,105.0)abc | 2 163.269d | <0.001 |
| WHR[M(P25,P75)] | 0.8(0.8,0.9) | 0.9(0.8,0.9)a | 0.9(0.8,0.9)ab | 0.9(0.9,1.0)abc | 1 657.277d | <0.001 |
| BMI[M(P25,P75),kg/m2] | 21.6(20.4,23) | 23.8(22.5,25.2)a | 25.3(24.1,26.8)ab | 27.8(26.1,29.8)abc | 2 693.996d | <0.001 |
| SBP[M(P25,P75),mmHg] | 125(114.5,139) | 137(124,150)a | 141(130,154.8)ab | 148(136,164)abc | 815.883d | <0.001 |
| DBP[M(P25,P75),mmHg] | 80(73,88) | 85(78,92)a | 87(80,94)ab | 90(83,98)abc | 509.637d | <0.001 |
| TG[M(P25,P75),mmol/L] | 0.9(0.7,1.2) | 1.2(0.9,1.6)a | 1.5(1.1,2.1)ab | 1.9(1.4,2.8)abc | 1 475.264d | <0.001 |
| TC[M(P25,P75),mmol/L] | 5.2(4.5,5.9) | 5.5(4.9,6.2)a | 5.6(4.9,6.3)a | 5.7(4.9,6.4)ab | 135.811d | <0.001 |
| HDL-C[M(P25,P75),mmol/L] | 1.5(1.3,1.8) | 1.4(1.2,1.6)a | 1.3(1.1,1.5)ab | 1.2(1.0,1.4)abc | 804.488d | <0.001 |
| LDL-C[M(P25,P75),mmol/L] | 2.6(2.1,3.2) | 3.1(2.5,3.7)a | 3.2(2.6,3.8)ab | 3.3(2.7,4.0)c | 323.765d | <0.001 |
| CRP[M(P25,P75),mg/L] | 0.1(0,0.2) | 0.2(0.1,0.6)a | 0.3(0.1,0.9)ab | 0.5(0.2,1.7)abc | 676.973d | <0.001 |
| ACR[M(P25,P75),mg/g] | 3.0(0.5,8.0) | 4.0(1.0,10.0) | 4.0(1.0,10.0)a | 6.0(1.0,15.0)abc | 54.319d | <0.001 |
| SUA[M(P25,P75),mmol/L] | 0.3(0.2,0.3) | 0.3(0.3,0.4)a | 0.3(0.3,0.4)ab | 0.4(0.3,0.4)abc | 632.705d | <0.001 |
| SCr[M(P25,P75),μmol/L] | 60(51,69) | 61(53,73)a | 63(55,74)ab | 65(56,76)abc | 123.407d | <0.001 |
| FPG[M(P25,P75),mmol/L] | 5.3(4.9,5.6) | 5.4(5.1,5.7)a | 5.4(5.1,5.8)ab | 5.5(5.2,6.0)abc | 265.249d | <0.001 |
| PBG 2 h[M(P25,P75),mmol/L] | 5.4(4.6,6.4) | 5.9(5.0,6.8)a | 6.2(5.3,7.3)ab | 6.8(5.7,8.1)abc | 464.850d | <0.001 |
| HbA1c[M(P25,P75),%] | 5.2(4.7,5.6) | 5.3(4.8,5.7)a | 5.3(4.9,5.8)ab | 5.4(5.0,5.8)abc | 106.361d | <0.001 |
| 变量 | 观察人数 | 发病人数 | 累积发病率(%) | χ2趋势值 | P趋势值 | 观察人年 | 发病密度(1/1 000人年) | χ2趋势值 | P趋势值 |
|---|---|---|---|---|---|---|---|---|---|
| CVAI | 131.865 | <0.001 | 100.105 | <0.001 | |||||
| Q1 | 1 254 | 58 | 4.63 | 3 919.50 | 14.80 | ||||
| Q2 | 1 278 | 90 | 7.04 | 3 912.42 | 23.00 | ||||
| Q3 | 1 272 | 151 | 11.87 | 3 926.33 | 38.46 | ||||
| Q4 | 1 276 | 225 | 17.63 | 3 926.08 | 57.31 | ||||
| VAI | 68.649 | <0.001 | 55.283 | <0.001 | |||||
| Q1 | 1 257 | 73 | 5.81 | 3 888.42 | 18.77 | ||||
| Q2 | 1 285 | 108 | 8.40 | 3 943.67 | 27.39 | ||||
| Q3 | 1 266 | 149 | 11.77 | 3 921.08 | 38.00 | ||||
| Q4 | 1 273 | 194 | 15.24 | 3 934.25 | 49.31 |
表4 不同CVAI和VAI四分位数研究人群的发病率
Table 4 Incidence of diabetes mellitus in different CVAI and VAI quartile groups
| 变量 | 观察人数 | 发病人数 | 累积发病率(%) | χ2趋势值 | P趋势值 | 观察人年 | 发病密度(1/1 000人年) | χ2趋势值 | P趋势值 |
|---|---|---|---|---|---|---|---|---|---|
| CVAI | 131.865 | <0.001 | 100.105 | <0.001 | |||||
| Q1 | 1 254 | 58 | 4.63 | 3 919.50 | 14.80 | ||||
| Q2 | 1 278 | 90 | 7.04 | 3 912.42 | 23.00 | ||||
| Q3 | 1 272 | 151 | 11.87 | 3 926.33 | 38.46 | ||||
| Q4 | 1 276 | 225 | 17.63 | 3 926.08 | 57.31 | ||||
| VAI | 68.649 | <0.001 | 55.283 | <0.001 | |||||
| Q1 | 1 257 | 73 | 5.81 | 3 888.42 | 18.77 | ||||
| Q2 | 1 285 | 108 | 8.40 | 3 943.67 | 27.39 | ||||
| Q3 | 1 266 | 149 | 11.77 | 3 921.08 | 38.00 | ||||
| Q4 | 1 273 | 194 | 15.24 | 3 934.25 | 49.31 |
| 自变量 | 赋值 |
|---|---|
| 年龄 | <45岁=1,45~60岁=2,>60岁=3 |
| 文化程度 | 小学以下=1,小学=2,初中=3,高中=4,大专及以上=5 |
| 婚姻状况 | 在婚=1,离婚/丧偶=2,未婚=3 |
| 糖尿病家族史 | 是=1,否=2 |
| 吸烟 | 是=1,否=2 |
| 参加体育活动 | 是=1,否=2 |
| SBP、DBP、CRP、ACR、SUA | 连续变量 |
表5 不同肥胖指标与糖尿病发病风险的多因素Cox回归分析变量赋值表
Table 5 Variable assignment of multivariable Cox regression analysis of the correlation between obesity indicators and risk of onset of diabetes mellitus
| 自变量 | 赋值 |
|---|---|
| 年龄 | <45岁=1,45~60岁=2,>60岁=3 |
| 文化程度 | 小学以下=1,小学=2,初中=3,高中=4,大专及以上=5 |
| 婚姻状况 | 在婚=1,离婚/丧偶=2,未婚=3 |
| 糖尿病家族史 | 是=1,否=2 |
| 吸烟 | 是=1,否=2 |
| 参加体育活动 | 是=1,否=2 |
| SBP、DBP、CRP、ACR、SUA | 连续变量 |
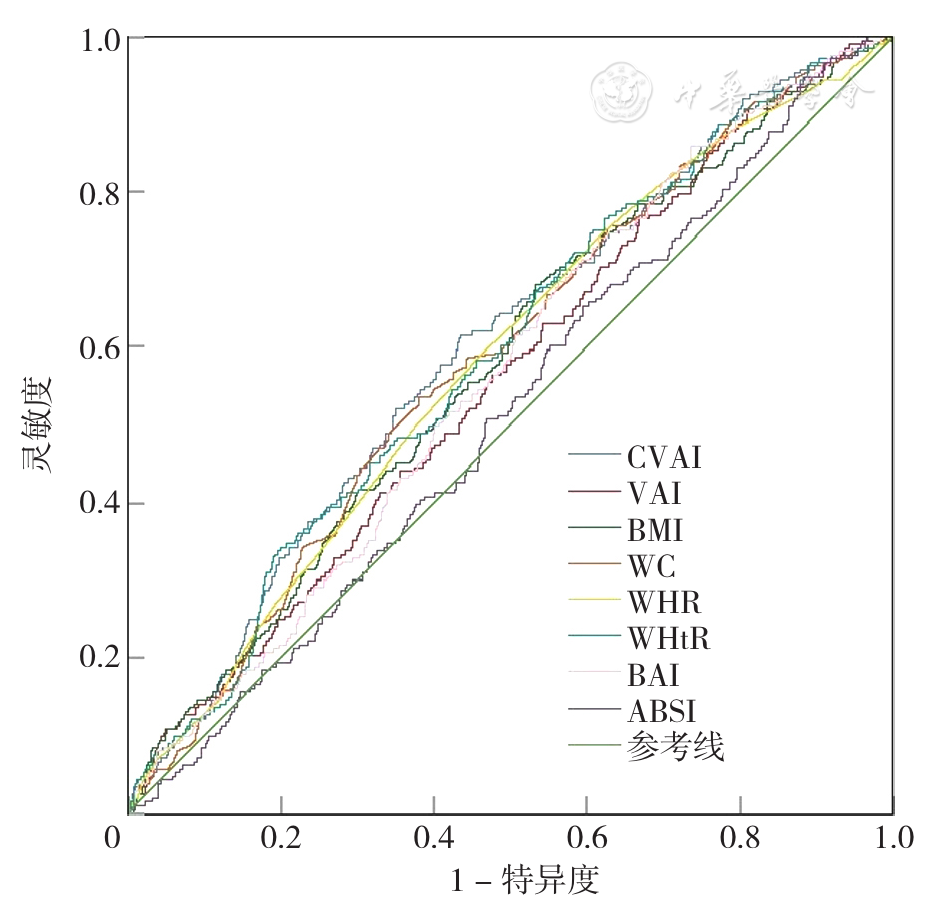
图1 不同肥胖指标预测男性糖尿病发病的ROC曲线注:CVAI=中国内脏脂肪指数,VAI=内脏脂肪指数,WC=腰围,WHR=腰臀比,WHtR=腰高比,BAI=身体肥胖指数,ABSI=身体形态指数。
Figure 1 ROC curve of different obesity indicators in predicting male diabetes mellitus
| 指标 | AUC(95%CI) | P值 | 截断值 | 灵敏度 | 特异度 | 约登指数 |
|---|---|---|---|---|---|---|
| CVAI | 0.600(0.561~0.640) | <0.001 | 104.118 | 0.615 | 0.566 | 0.181 |
| VAI | 0.560(0.521~0.600) | 0.004 | 0.967 | 0.765 | 0.333 | 0.098 |
| BMI | 0.578(0.538~0.618) | <0.001 | 24.615 kg/m2 | 0.681 | 0.467 | 0.148 |
| WC | 0.585(0.546~0.625) | <0.001 | 87.65 cm | 0.535 | 0.619 | 0.154 |
| WHR | 0.583(0.543~0.622) | <0.001 | 0.895 | 0.592 | 0.537 | 0.129 |
| WHtR | 0.591(0.551~0.630) | <0.001 | 0.496 | 0.751 | 0.393 | 0.144 |
| BAI | 0.565(0.526~0.603) | 0.002 | 25.222 | 0.742 | 0.384 | 0.126 |
| ABSI | 0.515(0.476~0.555) | 0.463 | 0.119 | 0.948 | 0.116 | 0.064 |
表6 男性不同肥胖指标预测糖尿病的AUC、截断值、灵敏度、特异度和约登指数
Table 6 AUC,cut-off value,sensitivity,specificity and Youden index of different obesity indicators in predicting male diabetes mellitus
| 指标 | AUC(95%CI) | P值 | 截断值 | 灵敏度 | 特异度 | 约登指数 |
|---|---|---|---|---|---|---|
| CVAI | 0.600(0.561~0.640) | <0.001 | 104.118 | 0.615 | 0.566 | 0.181 |
| VAI | 0.560(0.521~0.600) | 0.004 | 0.967 | 0.765 | 0.333 | 0.098 |
| BMI | 0.578(0.538~0.618) | <0.001 | 24.615 kg/m2 | 0.681 | 0.467 | 0.148 |
| WC | 0.585(0.546~0.625) | <0.001 | 87.65 cm | 0.535 | 0.619 | 0.154 |
| WHR | 0.583(0.543~0.622) | <0.001 | 0.895 | 0.592 | 0.537 | 0.129 |
| WHtR | 0.591(0.551~0.630) | <0.001 | 0.496 | 0.751 | 0.393 | 0.144 |
| BAI | 0.565(0.526~0.603) | 0.002 | 25.222 | 0.742 | 0.384 | 0.126 |
| ABSI | 0.515(0.476~0.555) | 0.463 | 0.119 | 0.948 | 0.116 | 0.064 |
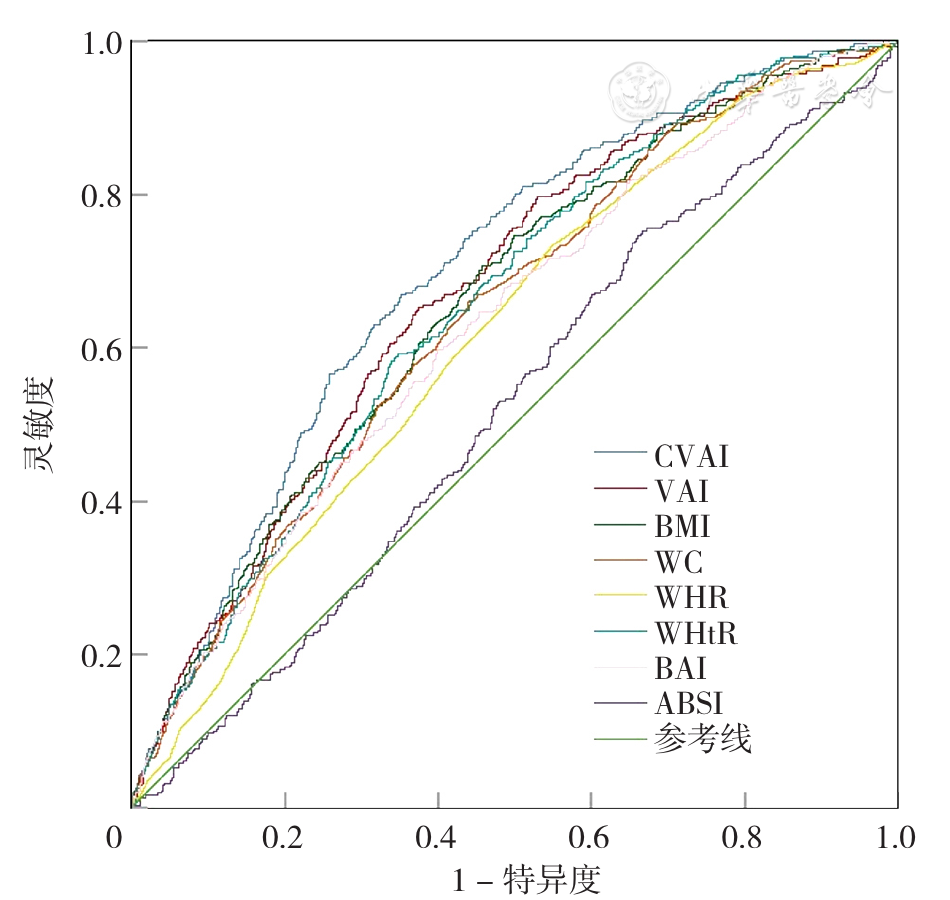
图2 不同肥胖指标预测女性糖尿病发病的ROC曲线
Figure 2 ROC curve of different obesity indicators in predicting female diabetes mellitus
| 指标 | AUC(95%CI) | P值 | 截断值 | 灵敏度 | 特异度 | 约登指数 |
|---|---|---|---|---|---|---|
| CVAI | 0.699(0.670~0.727) | <0.001 | 104.609 | 0.669 | 0.648 | 0.317 |
| VAI | 0.671(0.641~0.701)a | <0.001 | 1.954 | 0.653 | 0.626 | 0.279 |
| BMI | 0.659(0.629~0.690)a | <0.001 | 24.605 kg/m2 | 0.707 | 0.542 | 0.249 |
| WC | 0.643(0.612~0.674)a | <0.001 | 80.525 cm | 0.662 | 0.559 | 0.221 |
| WHR | 0.616(0.585~0.647)abcd | <0.001 | 0.835 | 0.733 | 0.452 | 0.185 |
| WHtR | 0.657(0.627~0.687)ade | <0.001 | 0.530 | 0.588 | 0.657 | 0.245 |
| BAI | 0.630(0.598~0.662)acf | <0.001 | 30.882 | 0.598 | 0.600 | 0.198 |
| ABSI | 0.520(0.488~0.552)abcdeg | 0.243 | 0.115 | 0.752 | 0.334 | 0.086 |
表7 女性不同肥胖指标预测糖尿病的AUC、截断值、灵敏度、特异度和约登指数
Table 7 AUC,cut-off value,sensitivity,specificity and Youden index of different obesity indicators in predicting female diabetes mellitus
| 指标 | AUC(95%CI) | P值 | 截断值 | 灵敏度 | 特异度 | 约登指数 |
|---|---|---|---|---|---|---|
| CVAI | 0.699(0.670~0.727) | <0.001 | 104.609 | 0.669 | 0.648 | 0.317 |
| VAI | 0.671(0.641~0.701)a | <0.001 | 1.954 | 0.653 | 0.626 | 0.279 |
| BMI | 0.659(0.629~0.690)a | <0.001 | 24.605 kg/m2 | 0.707 | 0.542 | 0.249 |
| WC | 0.643(0.612~0.674)a | <0.001 | 80.525 cm | 0.662 | 0.559 | 0.221 |
| WHR | 0.616(0.585~0.647)abcd | <0.001 | 0.835 | 0.733 | 0.452 | 0.185 |
| WHtR | 0.657(0.627~0.687)ade | <0.001 | 0.530 | 0.588 | 0.657 | 0.245 |
| BAI | 0.630(0.598~0.662)acf | <0.001 | 30.882 | 0.598 | 0.600 | 0.198 |
| ABSI | 0.520(0.488~0.552)abcdeg | 0.243 | 0.115 | 0.752 | 0.334 | 0.086 |
| [1] |
International Diabetes Federation. IDF Diabetes Atlas tenth edition 2021 [R/OL]. [2024-02-01].
|
| [2] |
中华医学会糖尿病学分会. 中国2型糖尿病防治指南(2020年版) [J]. 国际内分泌代谢杂志, 2021, 41 (5) : 482-548. DOI: 10.3760/cma.j.cn121383-20210825-08063.
|
| [3] |
CDC. 2020 National diabetes statistics report-estimates of diabetes and its burden in the United States[R]. [S.l.: s.n.]. 2020.
|
| [4] |
|
| [5] |
刘少博. 10省市队列人群糖尿病前期与糖尿病发病状况及影响因素研究 [D]. 北京: 中国疾病预防控制中心, 2020.
|
| [6] |
GBD 2021 Diabetes Collaborators. Global, regional, and national burden of diabetes from 1990 to 2021, with projections of prevalence to 2050: a systematic analysis for the Global Burden of Disease Study 2021 [J]. Lancet, 2023, 402 (10397) : 203-234. DOI: 10.1016/S0140-6736(23)01301-6.
|
| [7] |
|
| [8] |
|
| [9] |
|
| [10] |
中国成人血脂异常防治指南修订联合委员会. 中国成人血脂异常防治指南(2016年修订版) [J]. 中国循环杂志, 2016, 31 (10) : 937-950. DOI: 10.3969/j.issn.1000-3614.2016.10.001.
|
| [11] |
《中国成人超重和肥胖预防控制指南》修订委员会. 中国成人超重和肥胖症预防控制指南 [M]. 北京: 人民卫生出版社, 2021.
|
| [12] |
张爱红, 徐红, 孙艳丽, 等. 2000—2021年如东县2型糖尿病发病趋势分析 [J]. 中国初级卫生保健, 2024, 38 (1) : 46-49. DOI: 10.3969/j.issn.1001-568X.2024.01.0013.
|
| [13] |
周杰. 昆山市2008-2016年2型糖尿病发病趋势分析 [D]. 苏州: 苏州大学, 2018.
|
| [14] |
王卓, 江国虹, 郑文龙, 等. 2010—2019年天津市糖尿病发病特征及趋势 [J]. 中国慢性病预防与控制, 2023, 31 (7) : 526-529. DOI: 10.16386/j.cjpccd.issn.1004-6194.2023.07.011.
|
| [15] |
|
| [16] |
|
| [17] |
|
| [18] |
|
| [19] |
|
| [20] |
|
| [21] |
|
| [22] |
|
| [1] | 张家鸣, 王欣宇, 王道荣, 孙晓芳. 17~45岁肥胖门诊患者的6分钟步行试验距离参考方程研究[J]. 中国全科医学, 2025, 28(03): 330-334. |
| [2] | 高焱, 杨淑显, 范雷, 常亮, 高莉, 张寒雪, 李卉, 康锴. 老年人群骨关节疾病流行特征及其影响因素研究[J]. 中国全科医学, 2025, 28(03): 280-284. |
| [3] | 彭红叶, 荆雅楠, 留典淳, 王莹, 薛雪, 鲁春丽. 糖尿病前期中西医结合早期诊断的国内外进展与挑战[J]. 中国全科医学, 2025, 28(03): 262-272. |
| [4] | 卢静, 孙国珍, 王洁, 高敏, 于甜栖, 孙姝怡, 王琴, 温高芹. 慢性心力衰竭患者社会衰弱现状及其影响因素可解释性分析研究[J]. 中国全科医学, 2025, 28(02): 220-227. |
| [5] | 舒婷, 兰志鹏, 巫霞, 罗映娟, 杨柳. 宫颈癌筛查妇女高危型人乳头瘤病毒感染现状及影响因素研究:基于成都市45万人群[J]. 中国全科医学, 2025, 28(02): 213-219. |
| [6] | 贾佳, 刘嘉慧, 季文君, 郑博, 王新刚, 范芳芳, 李寅, 张龙, 张岩. 急性心肌梗死患者血浆前蛋白转化酶枯草溶菌素9水平的影响因素研究[J]. 中国全科医学, 2024, 27(36): 4568-4574. |
| [7] | 高澜, 张祥凝, 谢昊泰, 范芳芳, 贾佳, 李建平, 马为, 张岩. 社区人群心内膜下心肌活力率的影响因素研究[J]. 中国全科医学, 2024, 27(36): 4554-4560. |
| [8] | 柴梅梅, 包信娟, 曾梅, 李芙兰, 汉瑞娟. 肺癌术后患者持续性咳嗽发生率及影响因素的Meta分析[J]. 中国全科医学, 2024, 27(34): 4350-4352. |
| [9] | 曹晨晨, 刘志刚, 刘世蒙, 郑吕云, 薛文静, 陈英耀, 刘静. 中国南北两地2型糖尿病患者二线用药偏好差异研究[J]. 中国全科医学, 2024, 27(34): 4264-4272. |
| [10] | 张亚琳, 刘力滴, 陈正勇, 刘长明, 杨梓钰, 曹毅, 廖晓阳. 医联体背景下基层医疗卫生机构服务能力及影响因素研究[J]. 中国全科医学, 2024, 27(34): 4302-4307. |
| [11] | 卢威, 杨云松, 林连美, 刘琼, 赵敏, 李佳, 梁凤霞, 吴松. 基于下丘脑-垂体-性腺轴探析补肾法治疗2型糖尿病生精障碍的思路[J]. 中国全科医学, 2024, 27(33): 4210-4214. |
| [12] | 谢同玲, 颜菲菲, 张怡, 宋冬梅, 陈天勇, 孟静怡, 耿劲松. 糖尿病患者用药偏好及循证决策辅助工具研究[J]. 中国全科医学, 2024, 27(33): 4105-4111. |
| [13] | 张冰青, 胡馨云, 欧阳煜钦, 向心月, 汤文娟, 冯文焕. 非肥胖2型糖尿病患者肌肉量减少危险因素的列线图预测模型研究[J]. 中国全科医学, 2024, 27(33): 4139-4146. |
| [14] | 中国微循环学会糖尿病与微循环专业委员会, 中华医学会内分泌学分会基层内分泌代谢病学组. 基层糖尿病微血管疾病筛查与防治专家共识(2024)[J]. 中国全科医学, 2024, 27(32): 3969-3986. |
| [15] | 吴心怡, 张永泽, 阳成虎, 吴晓园. 数字健康背景下糖尿病基层医防融合服务的需求研究[J]. 中国全科医学, 2024, 27(31): 3958-3965. |
| 阅读次数 | ||||||
|
全文 |
|
|||||
|
摘要 |
|
|||||


